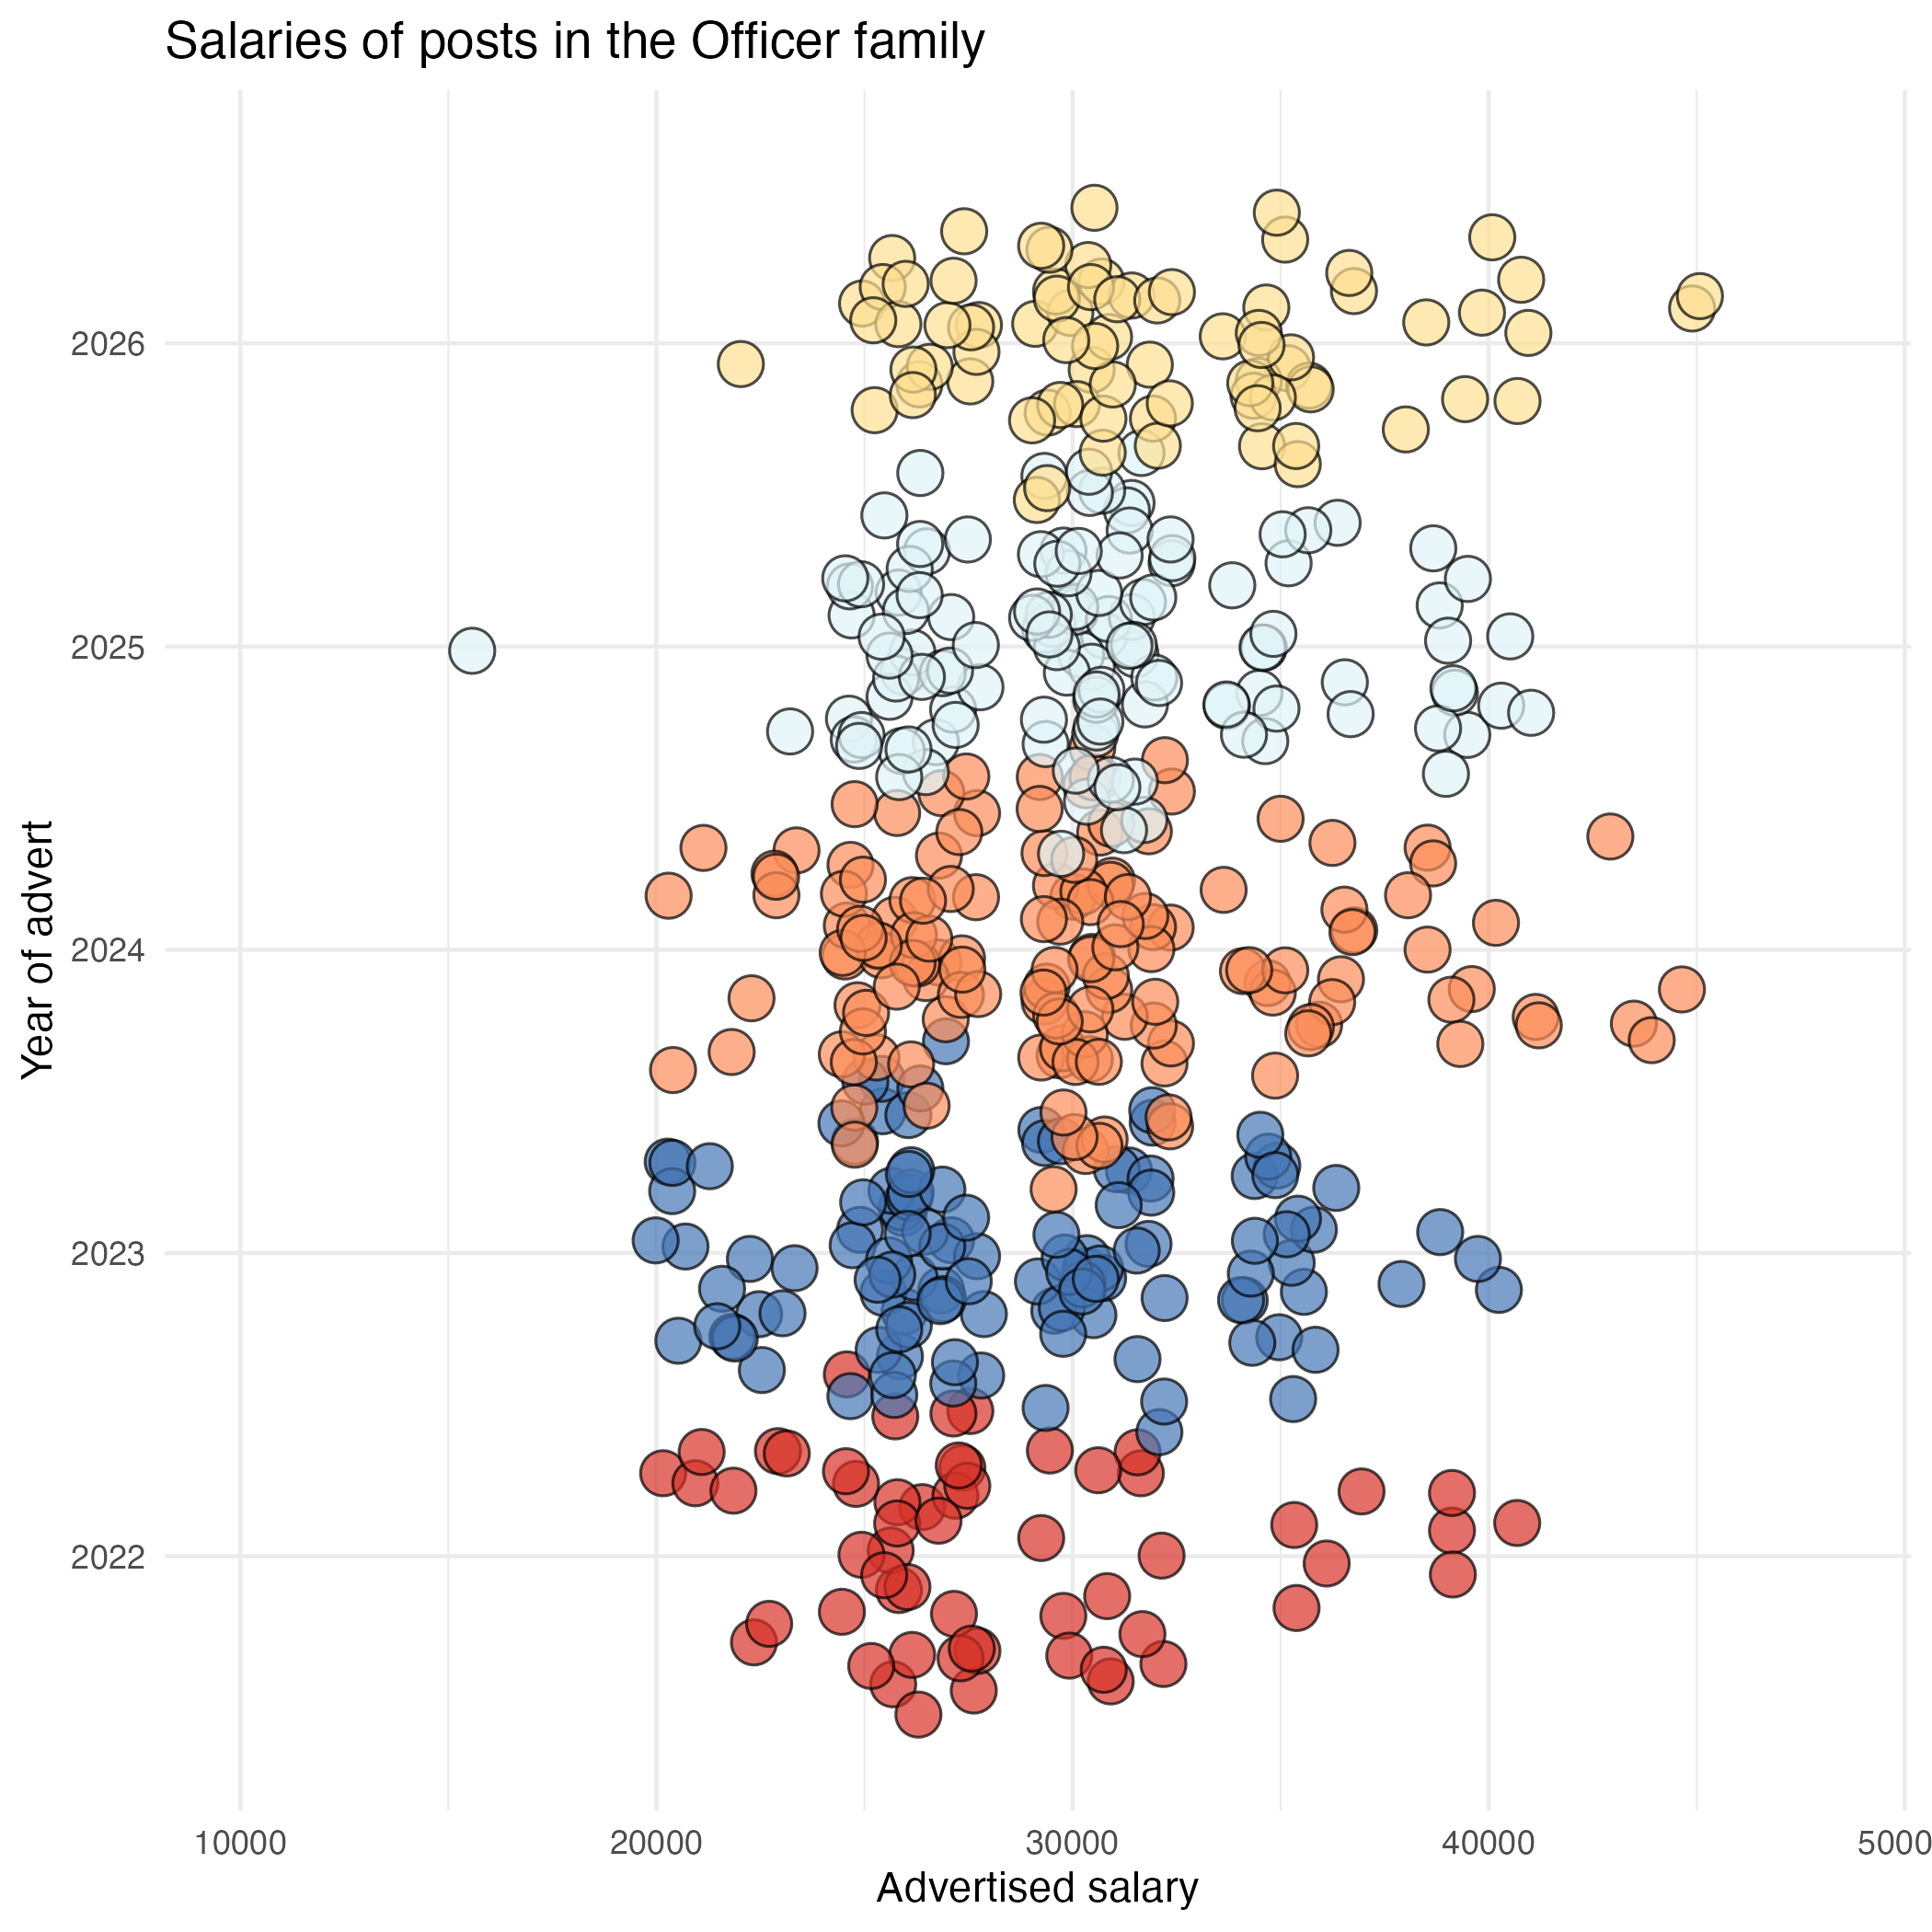
Officers get paid a lot less than analysts but their pay is increasing
What does the data tell us about data officer roles in nonprofits?
This is part four of a several part series analysing four years of data vacancy data in nonprofits.
Part one gives an overview and explains a bit more about the dataset.
Officers
This is a job family that covers roles that have a technical focus but at a lower level than Analysts. It includes jobs such as “Data Officer, Data Selections Officer and Data Co-ordinator”.
How much officers get paid
Analyst roles had median salaries of £31,565 in 2026. This was up from £27,644 in 2022.
This increase is striking when compared to Analyst roles which were largely flat across the same time period.
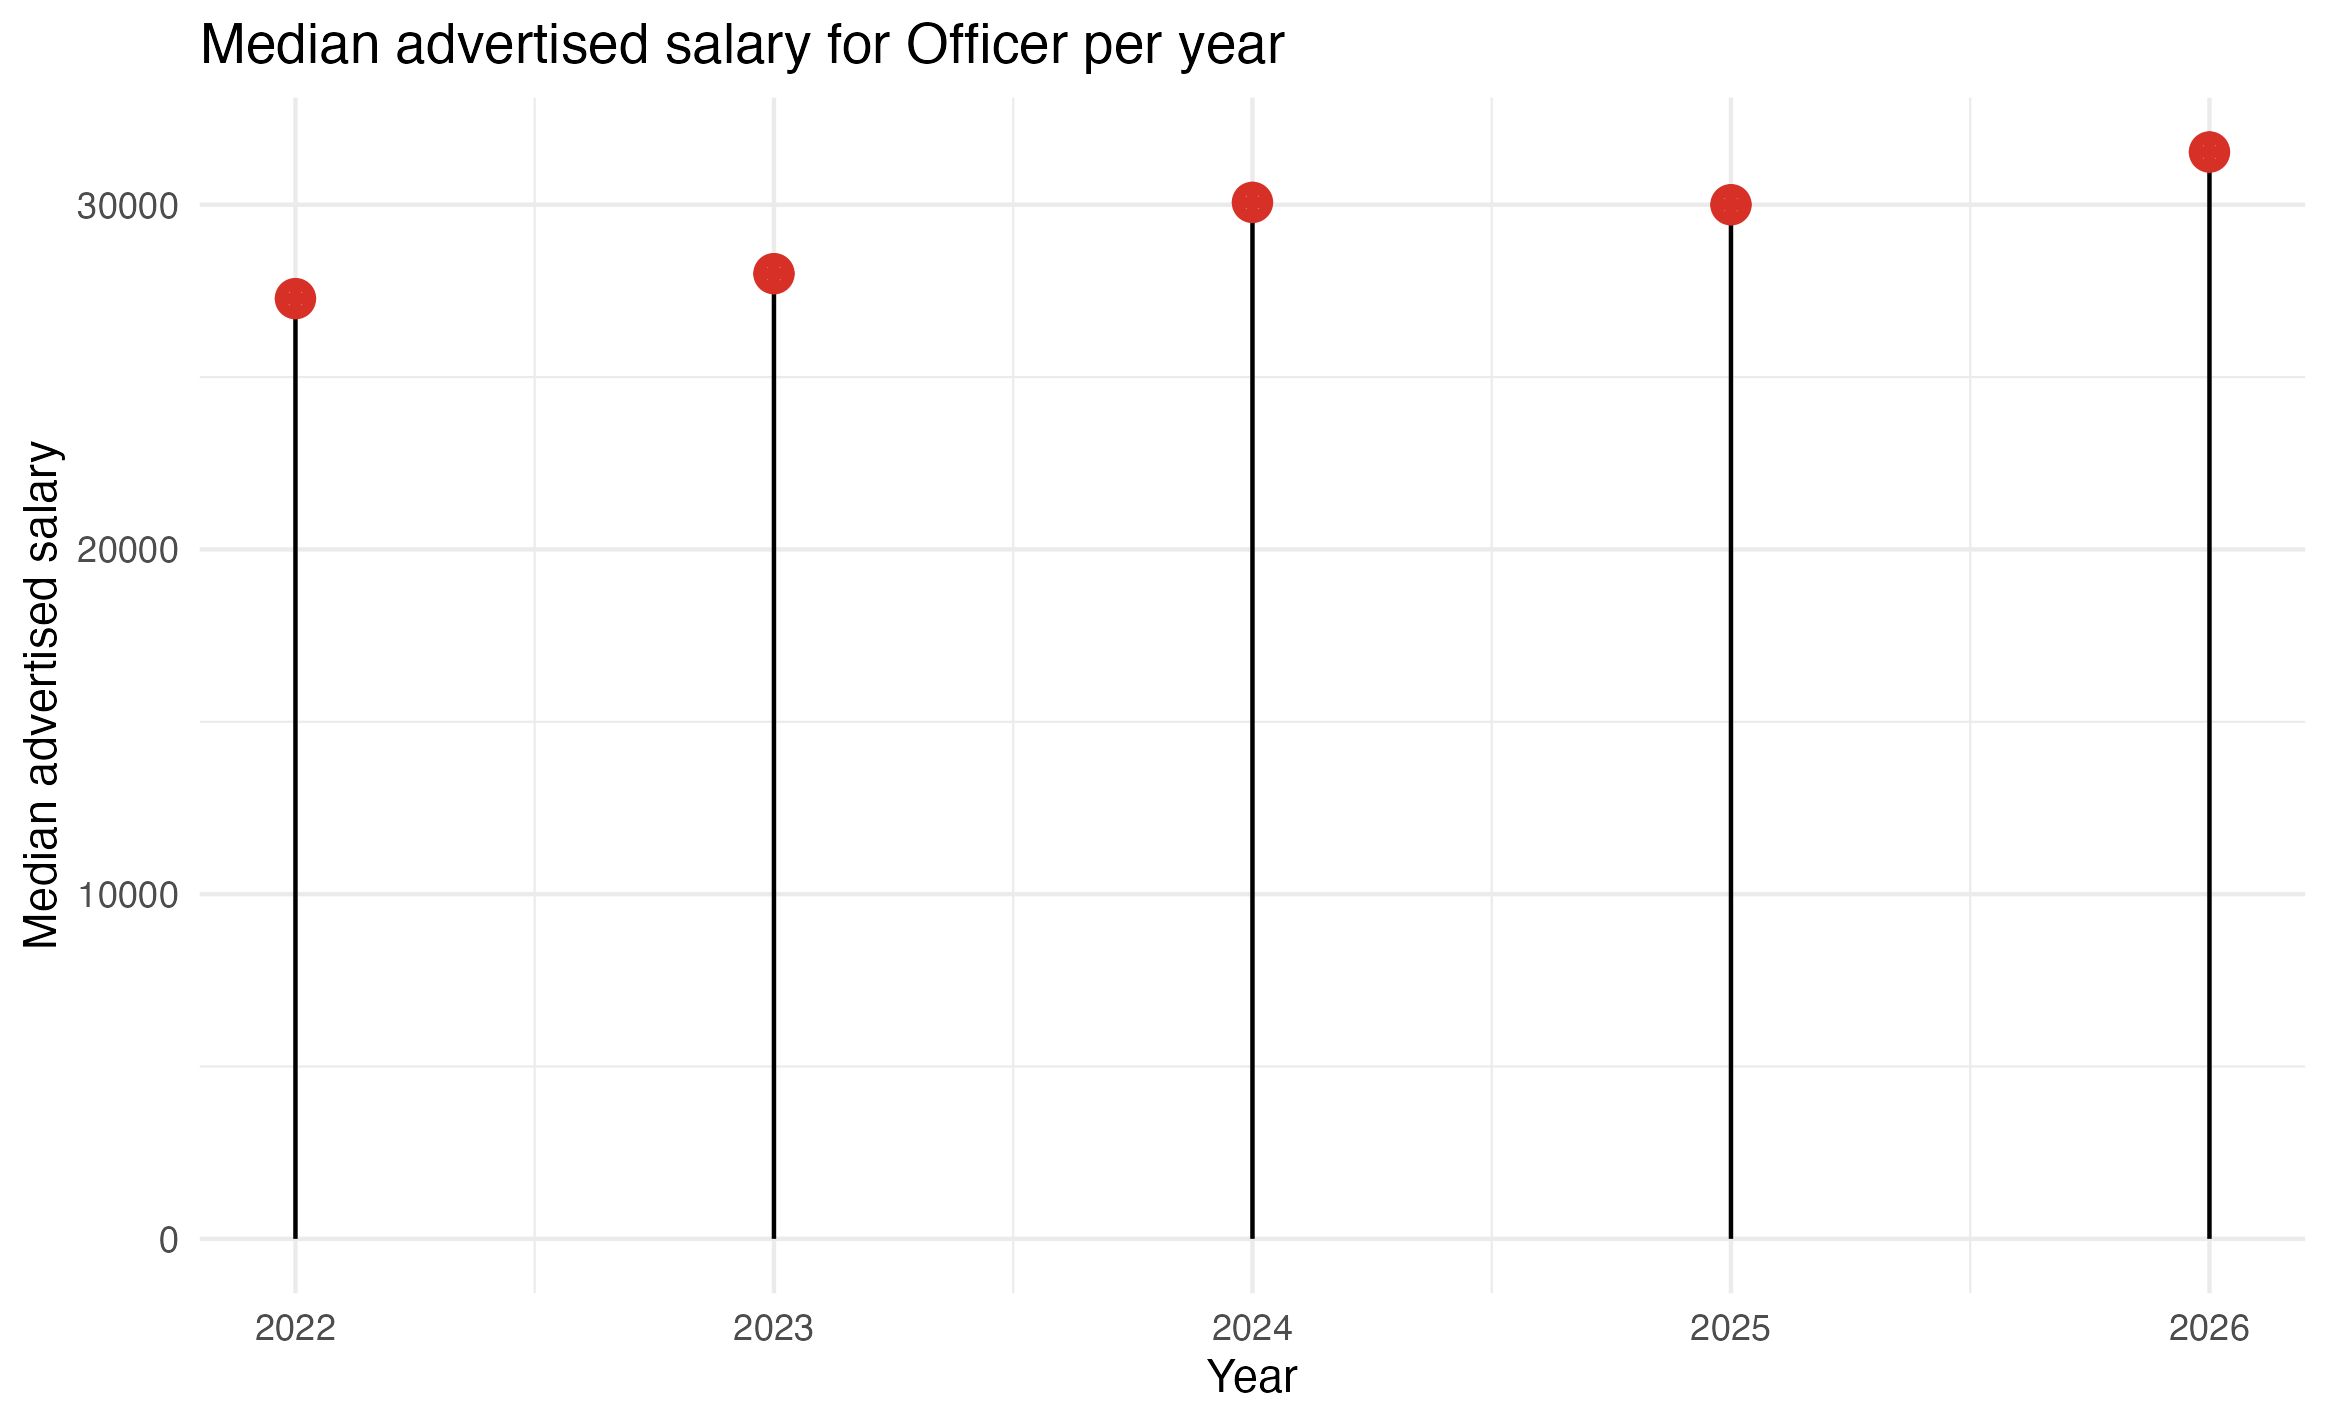
Averages are all very well but what you really want to know is whether you are competitive in the market. That’s what these dumbell charts try to help you with.
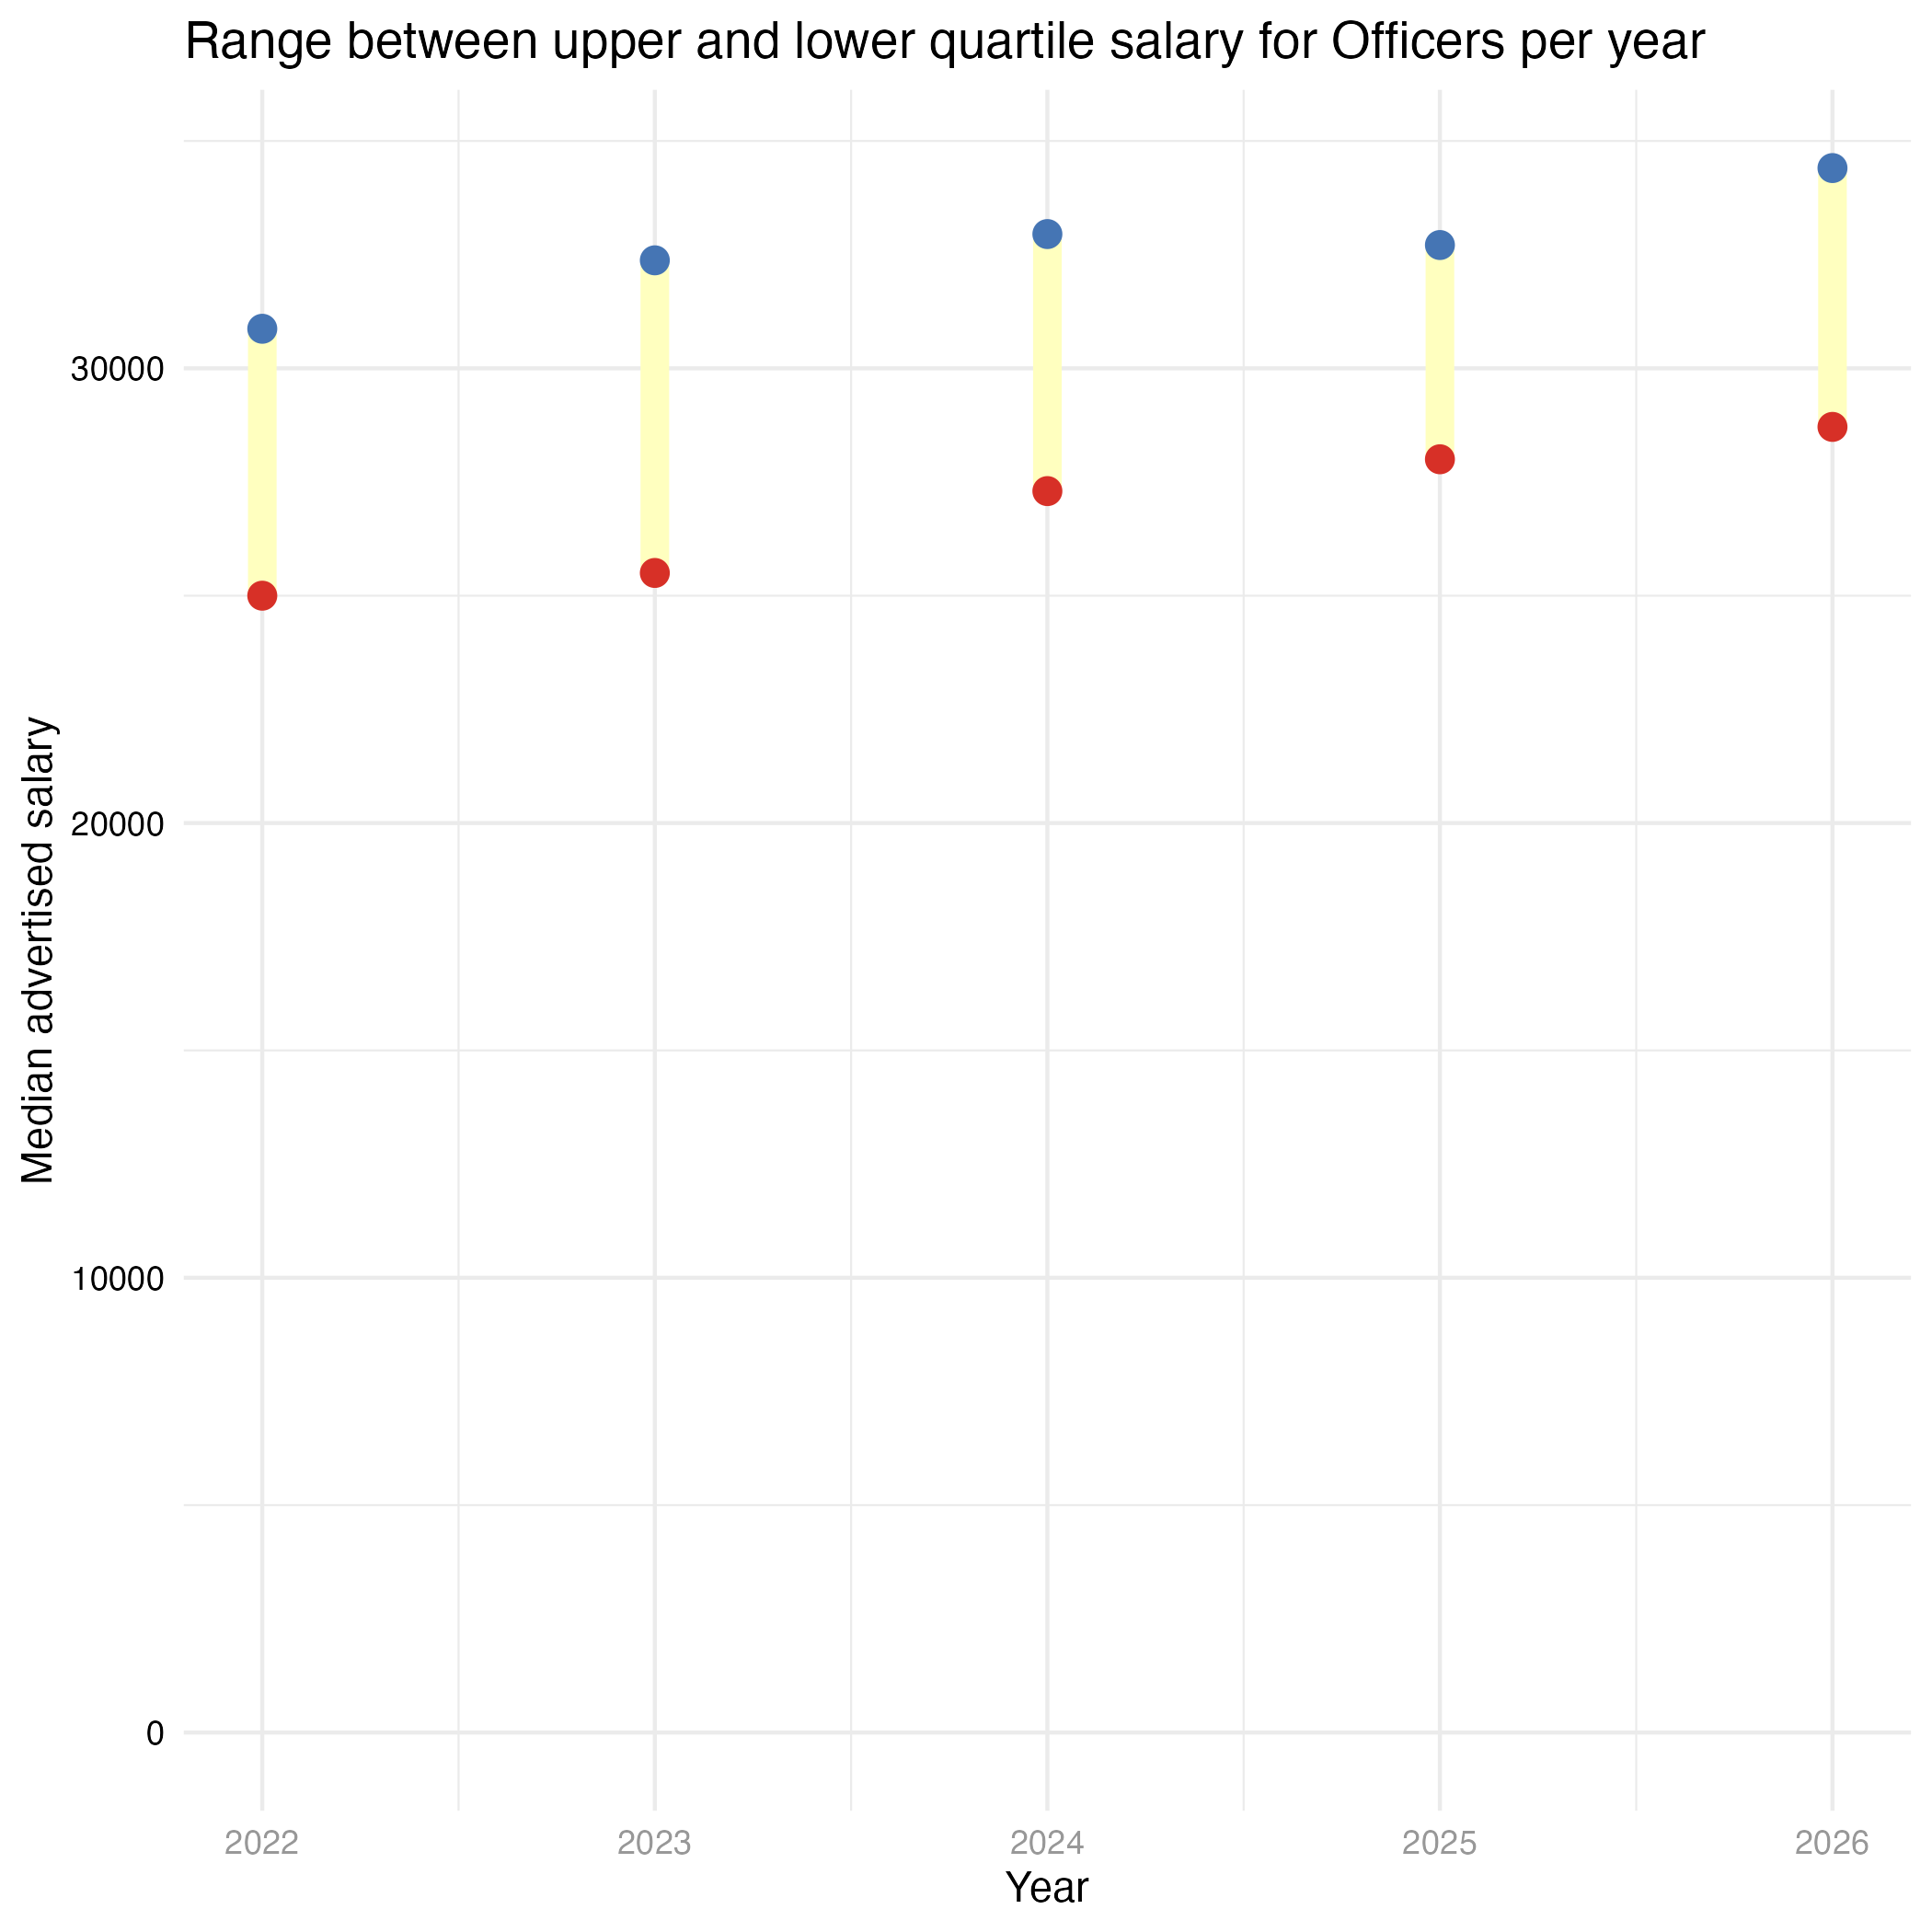
If your salary is between the dots then you're in the same range as 50% of officers. If your salary is lower than the lower dot you're in the range where only 25% of officers get paid this little. If your salary is higher than the high dot, you're in the range where only 25% of analysts get paid this much.
So in 2026 the range is from £28,712 to £34,404. Which only barely overlaps with analyst roles (the range there between £33K and £42K). I think it’s worth asking yourself whether you need an analyst given the premium you’ll be paying over an officer.
These roles include London weighting where that is relevant.
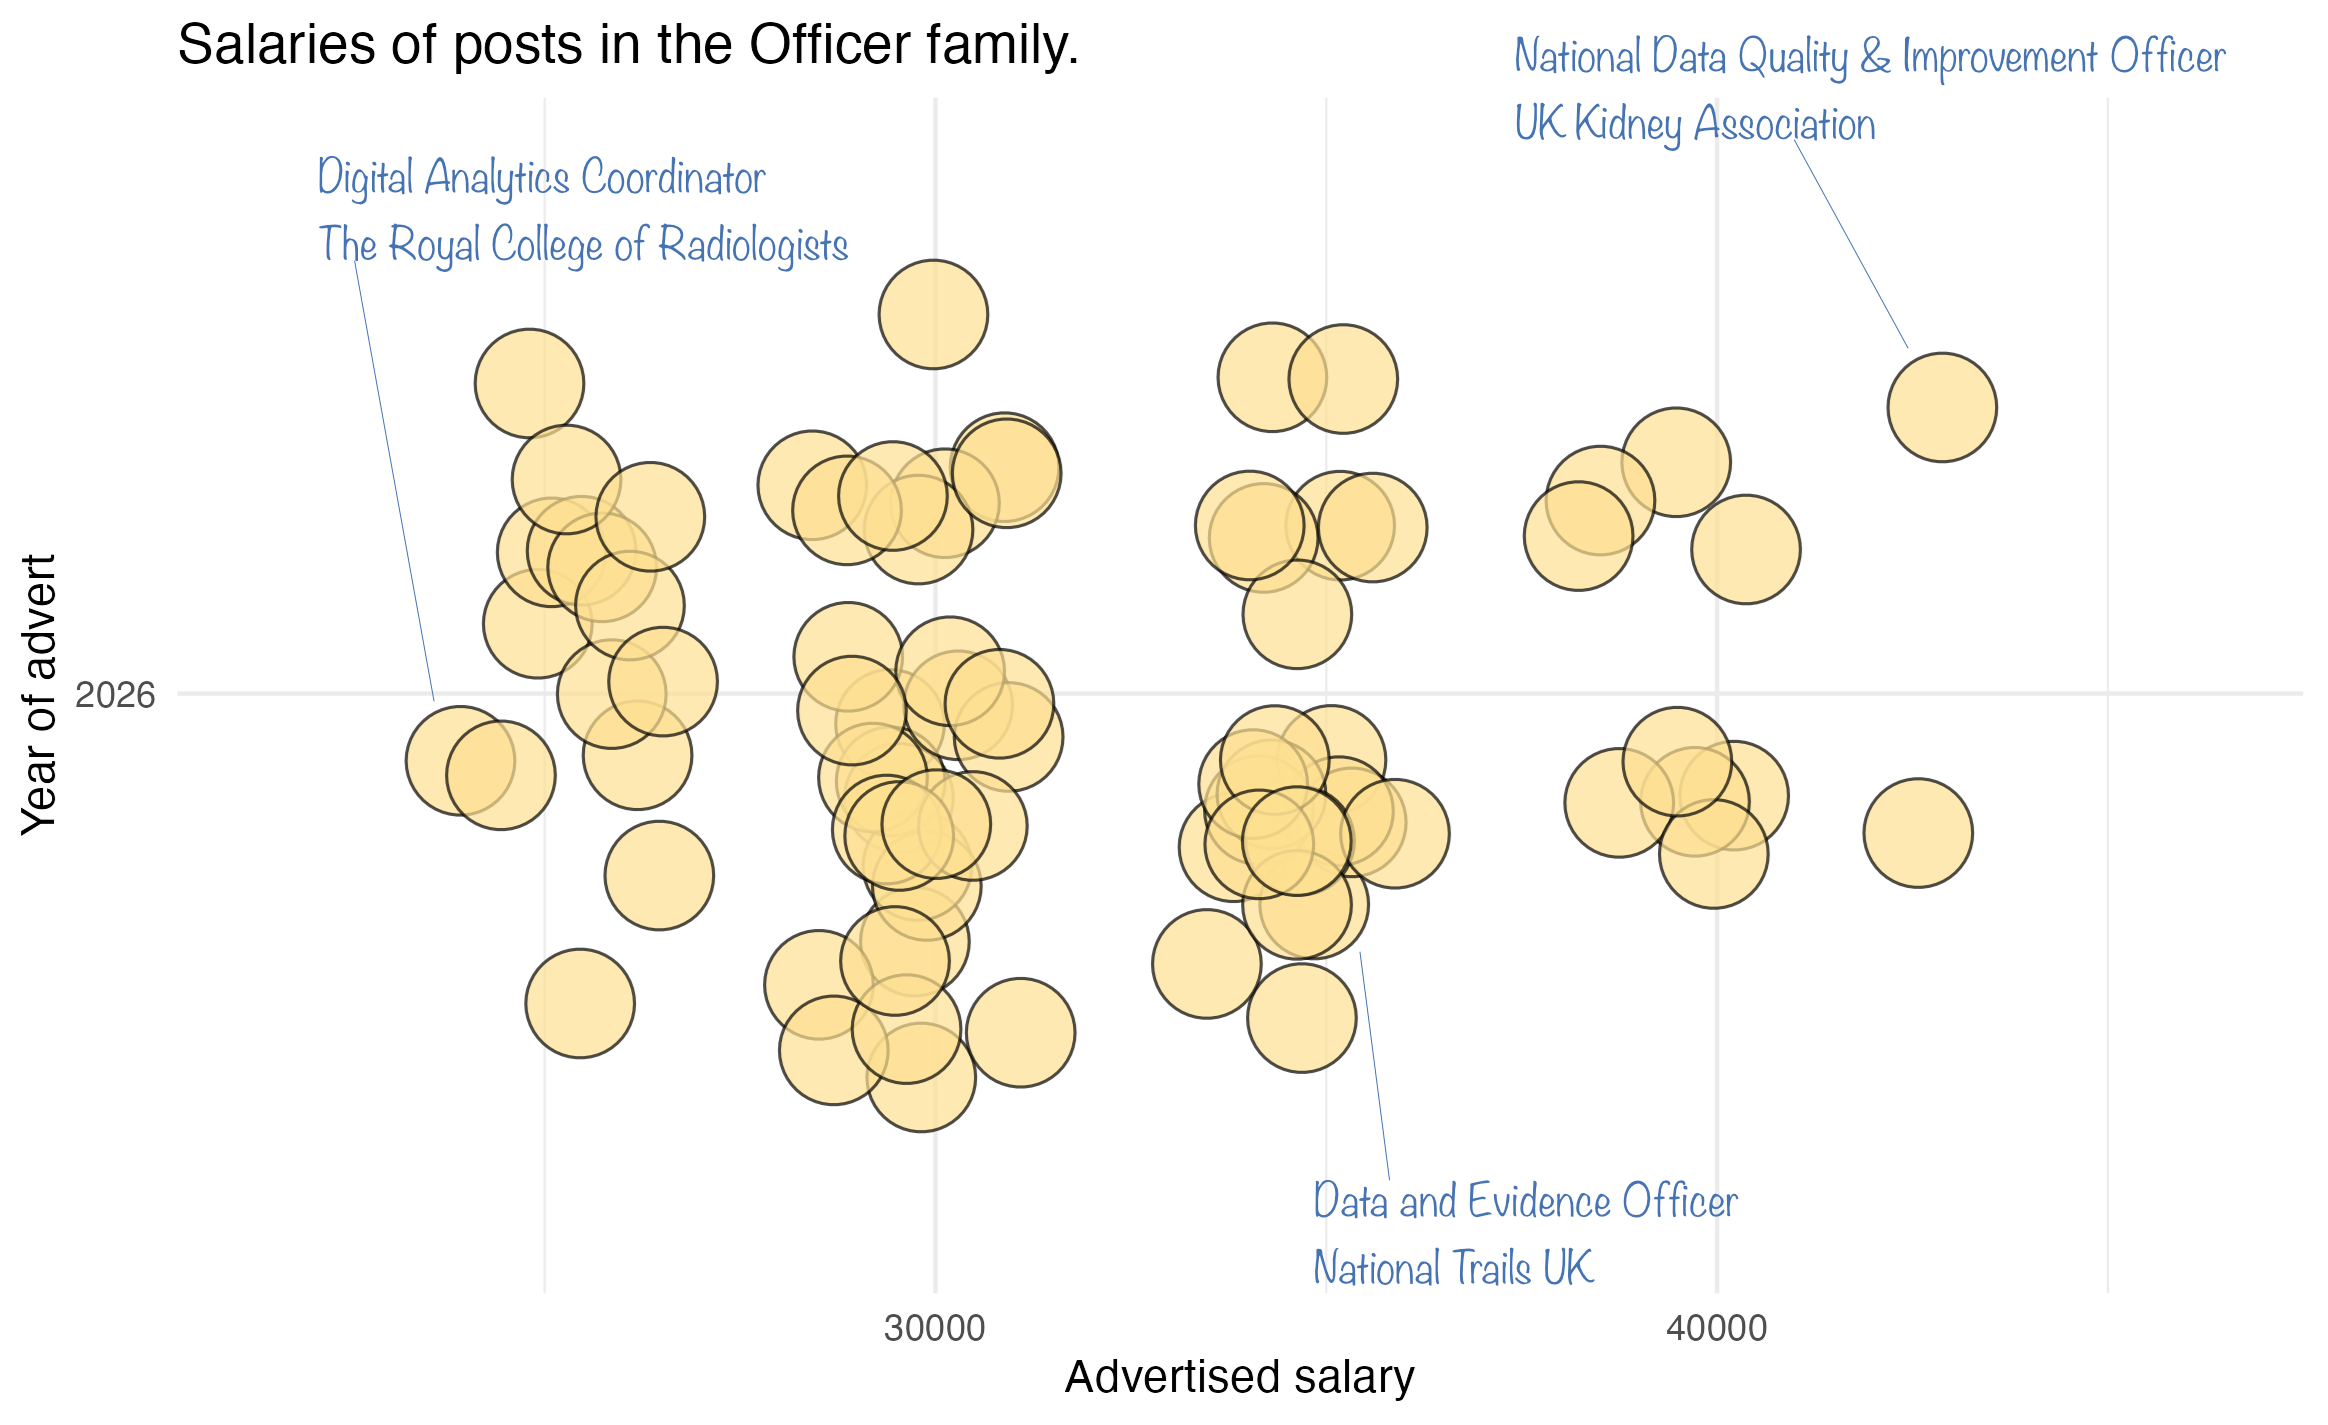
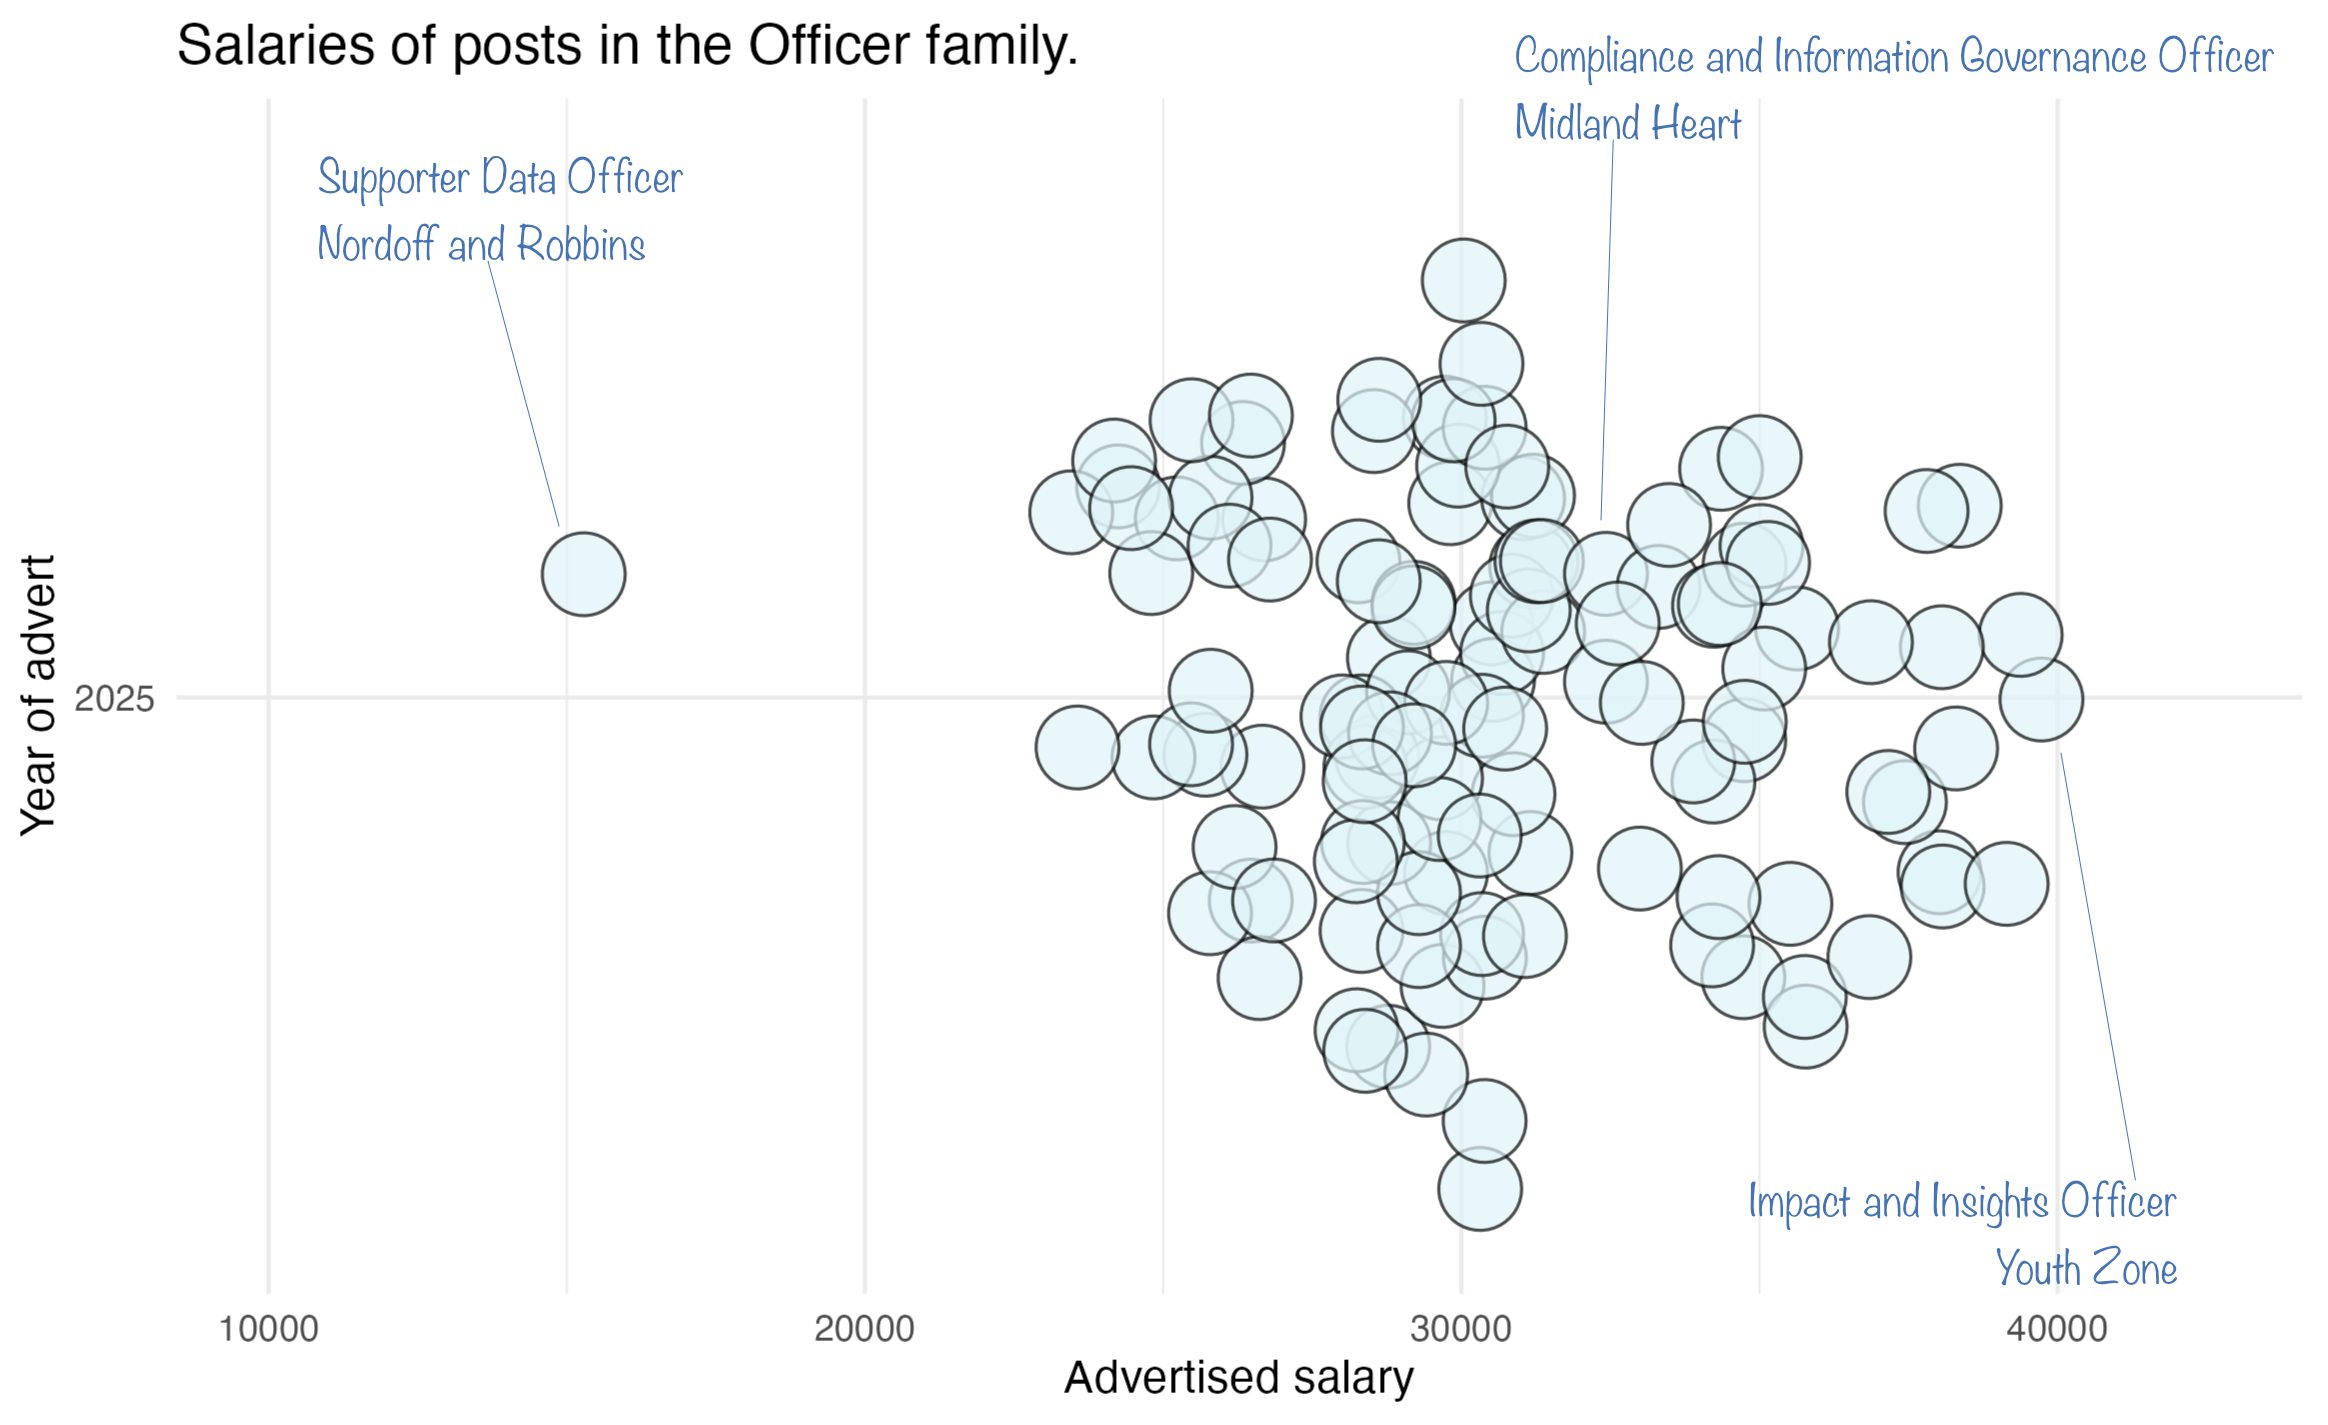
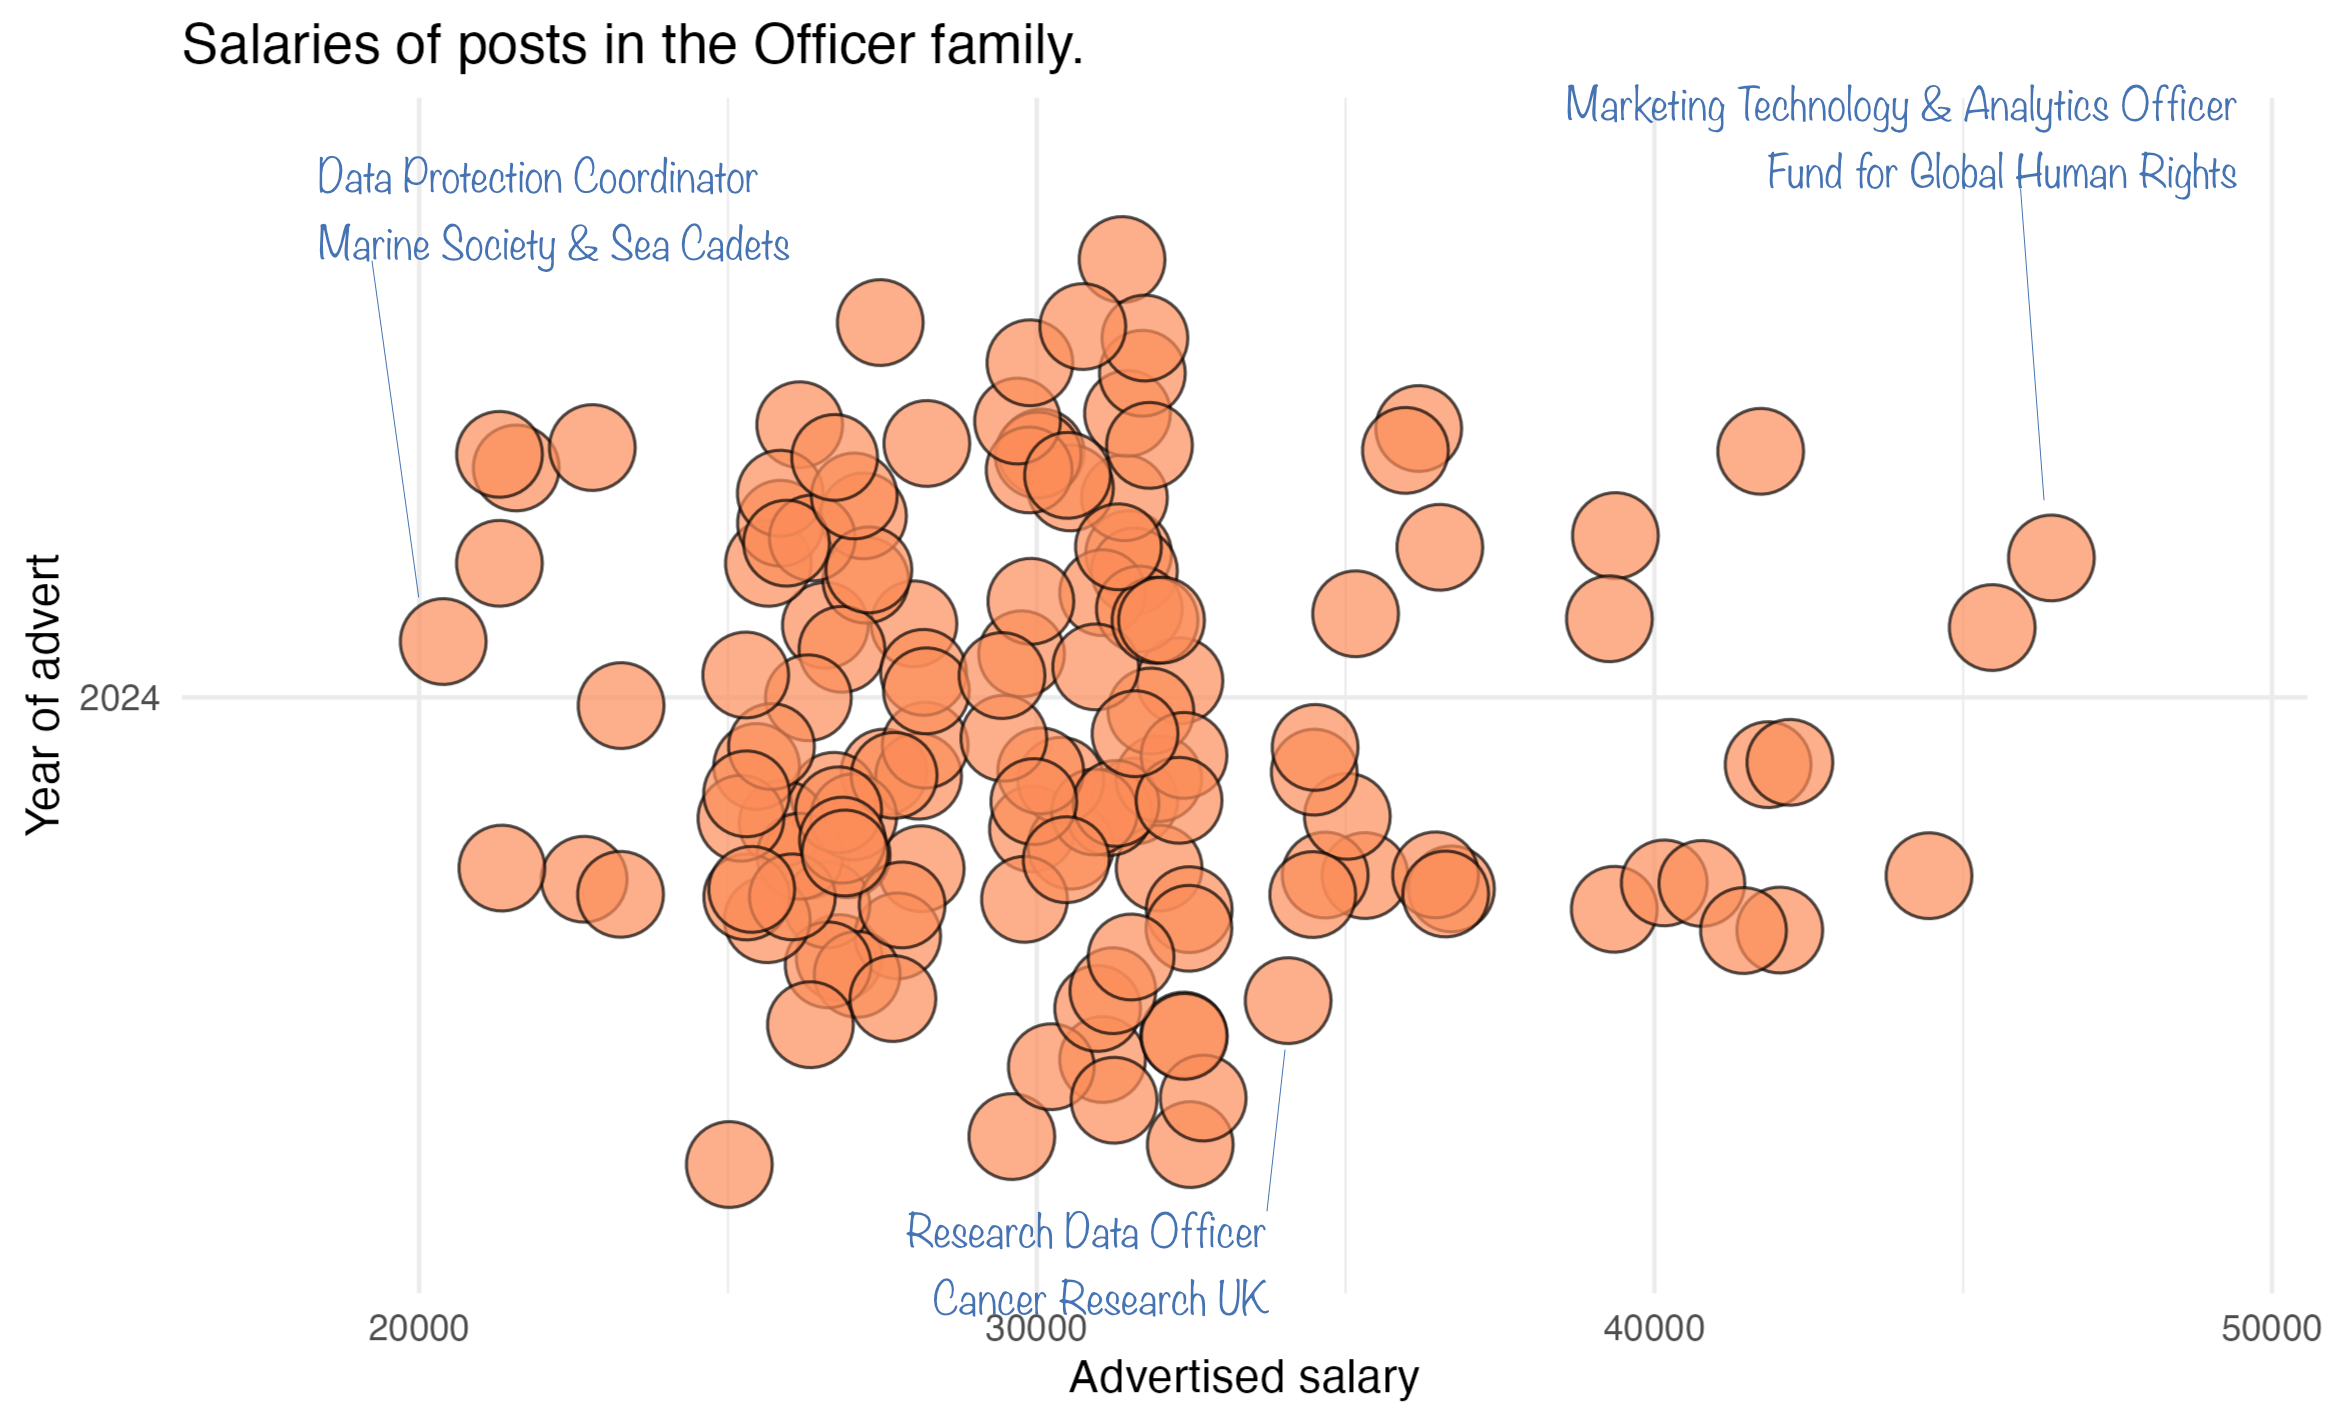
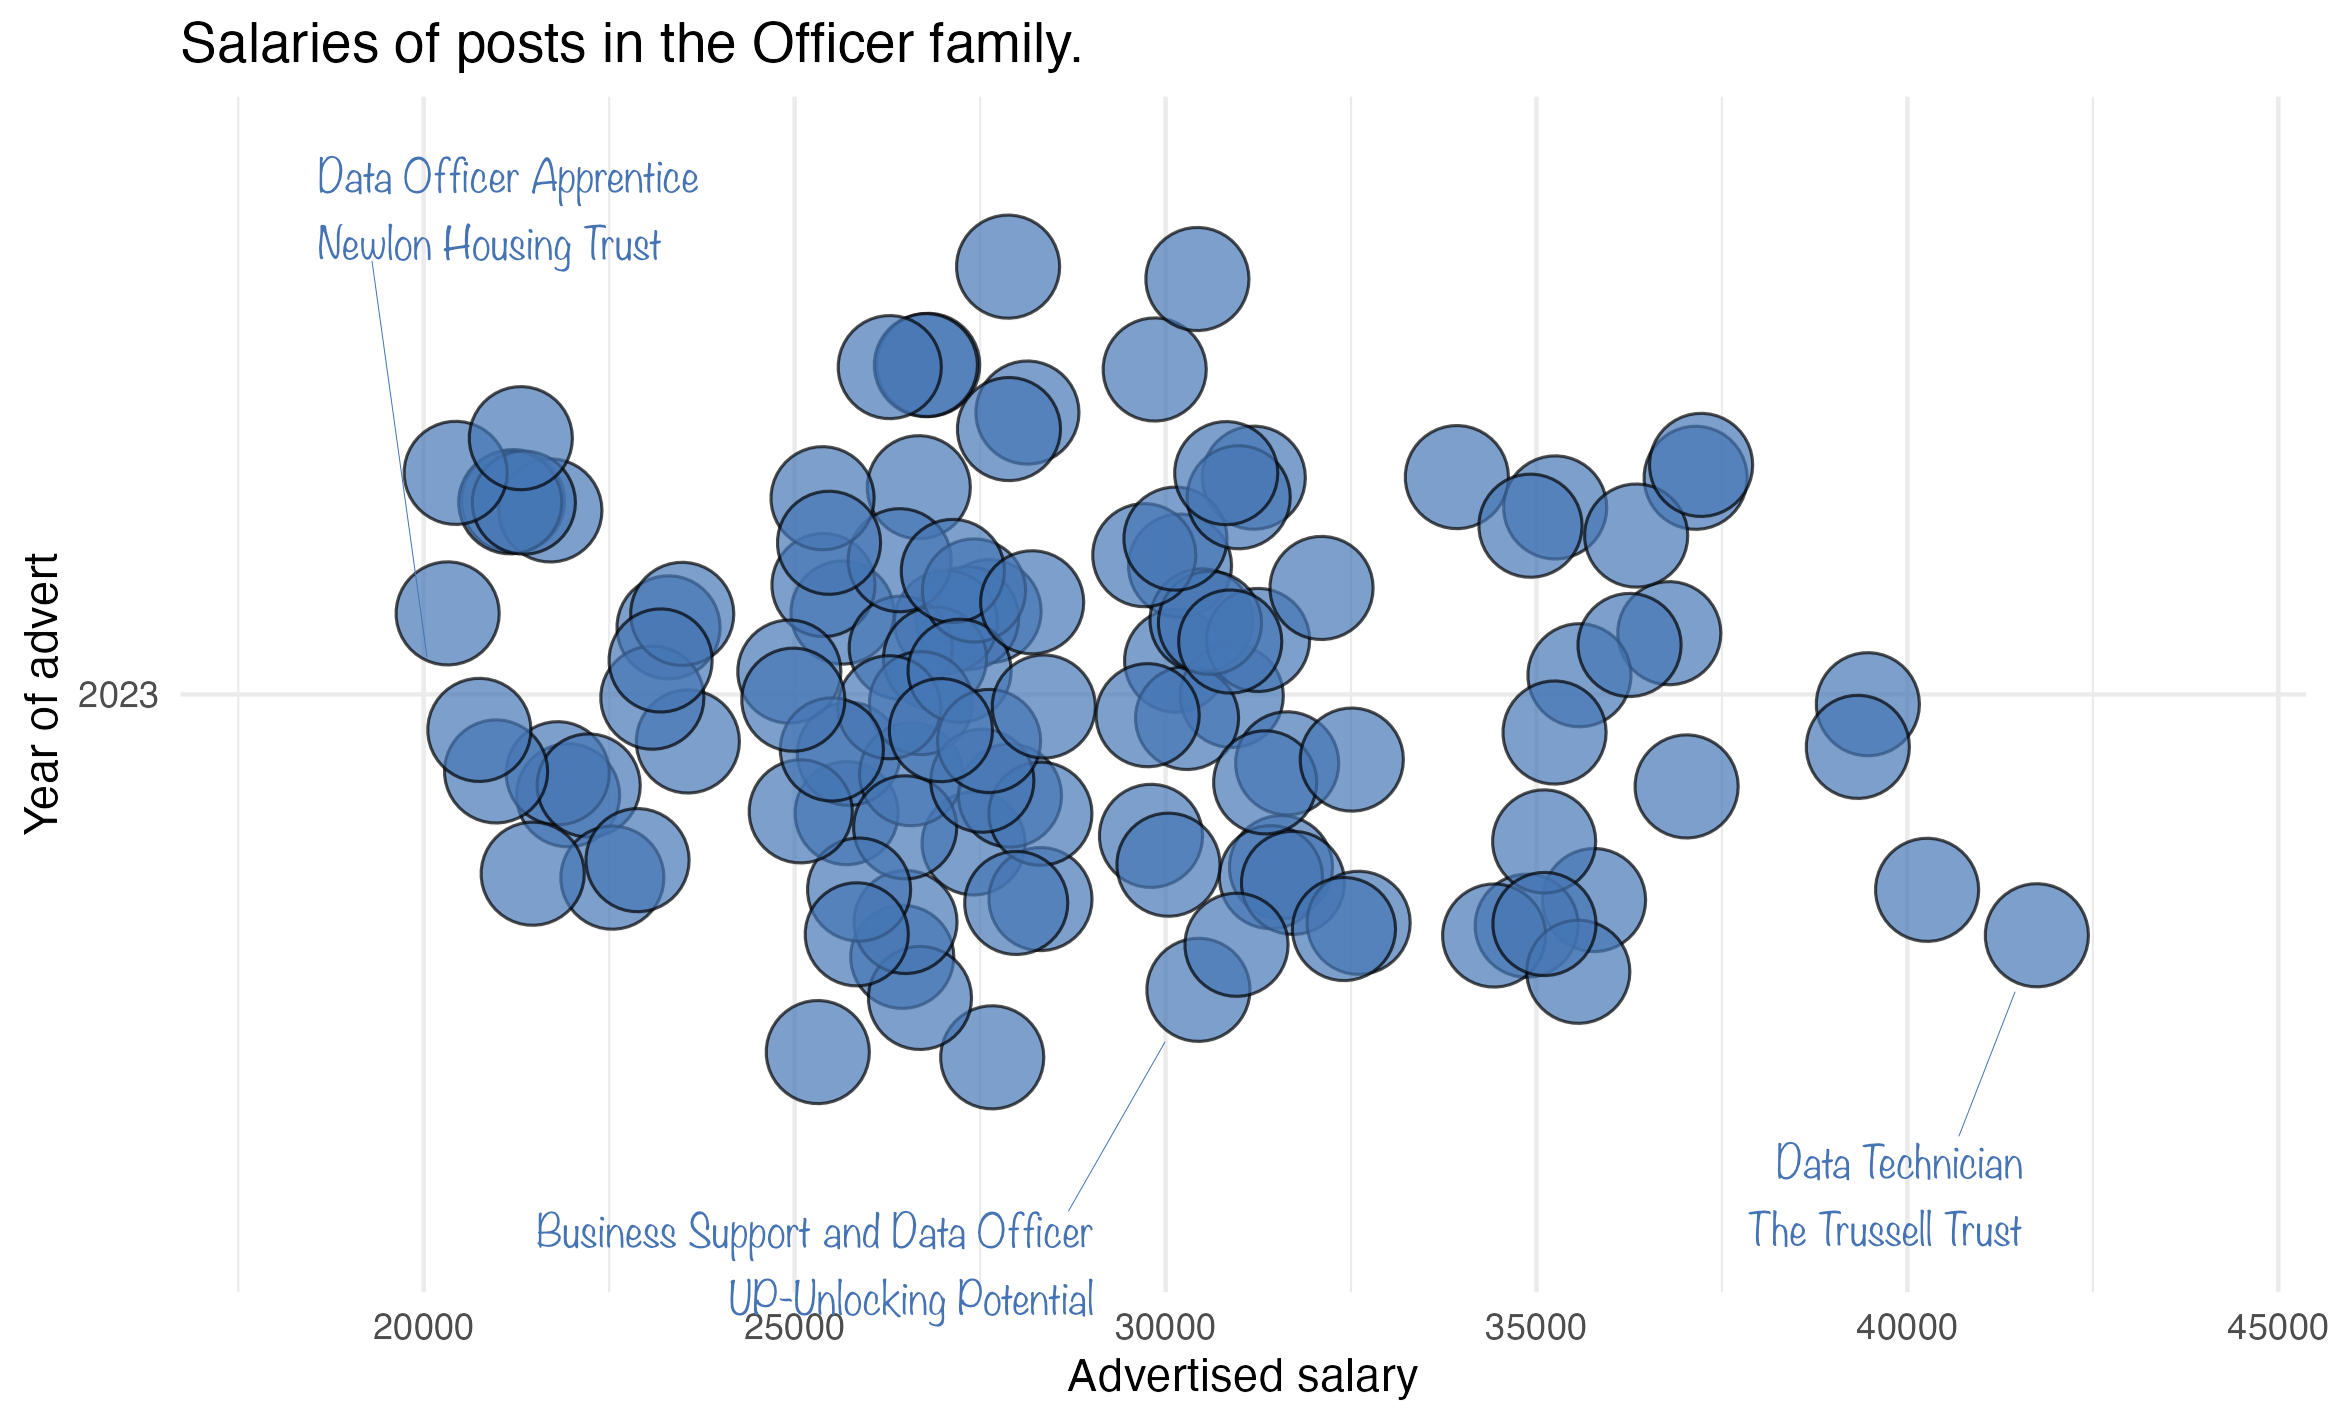
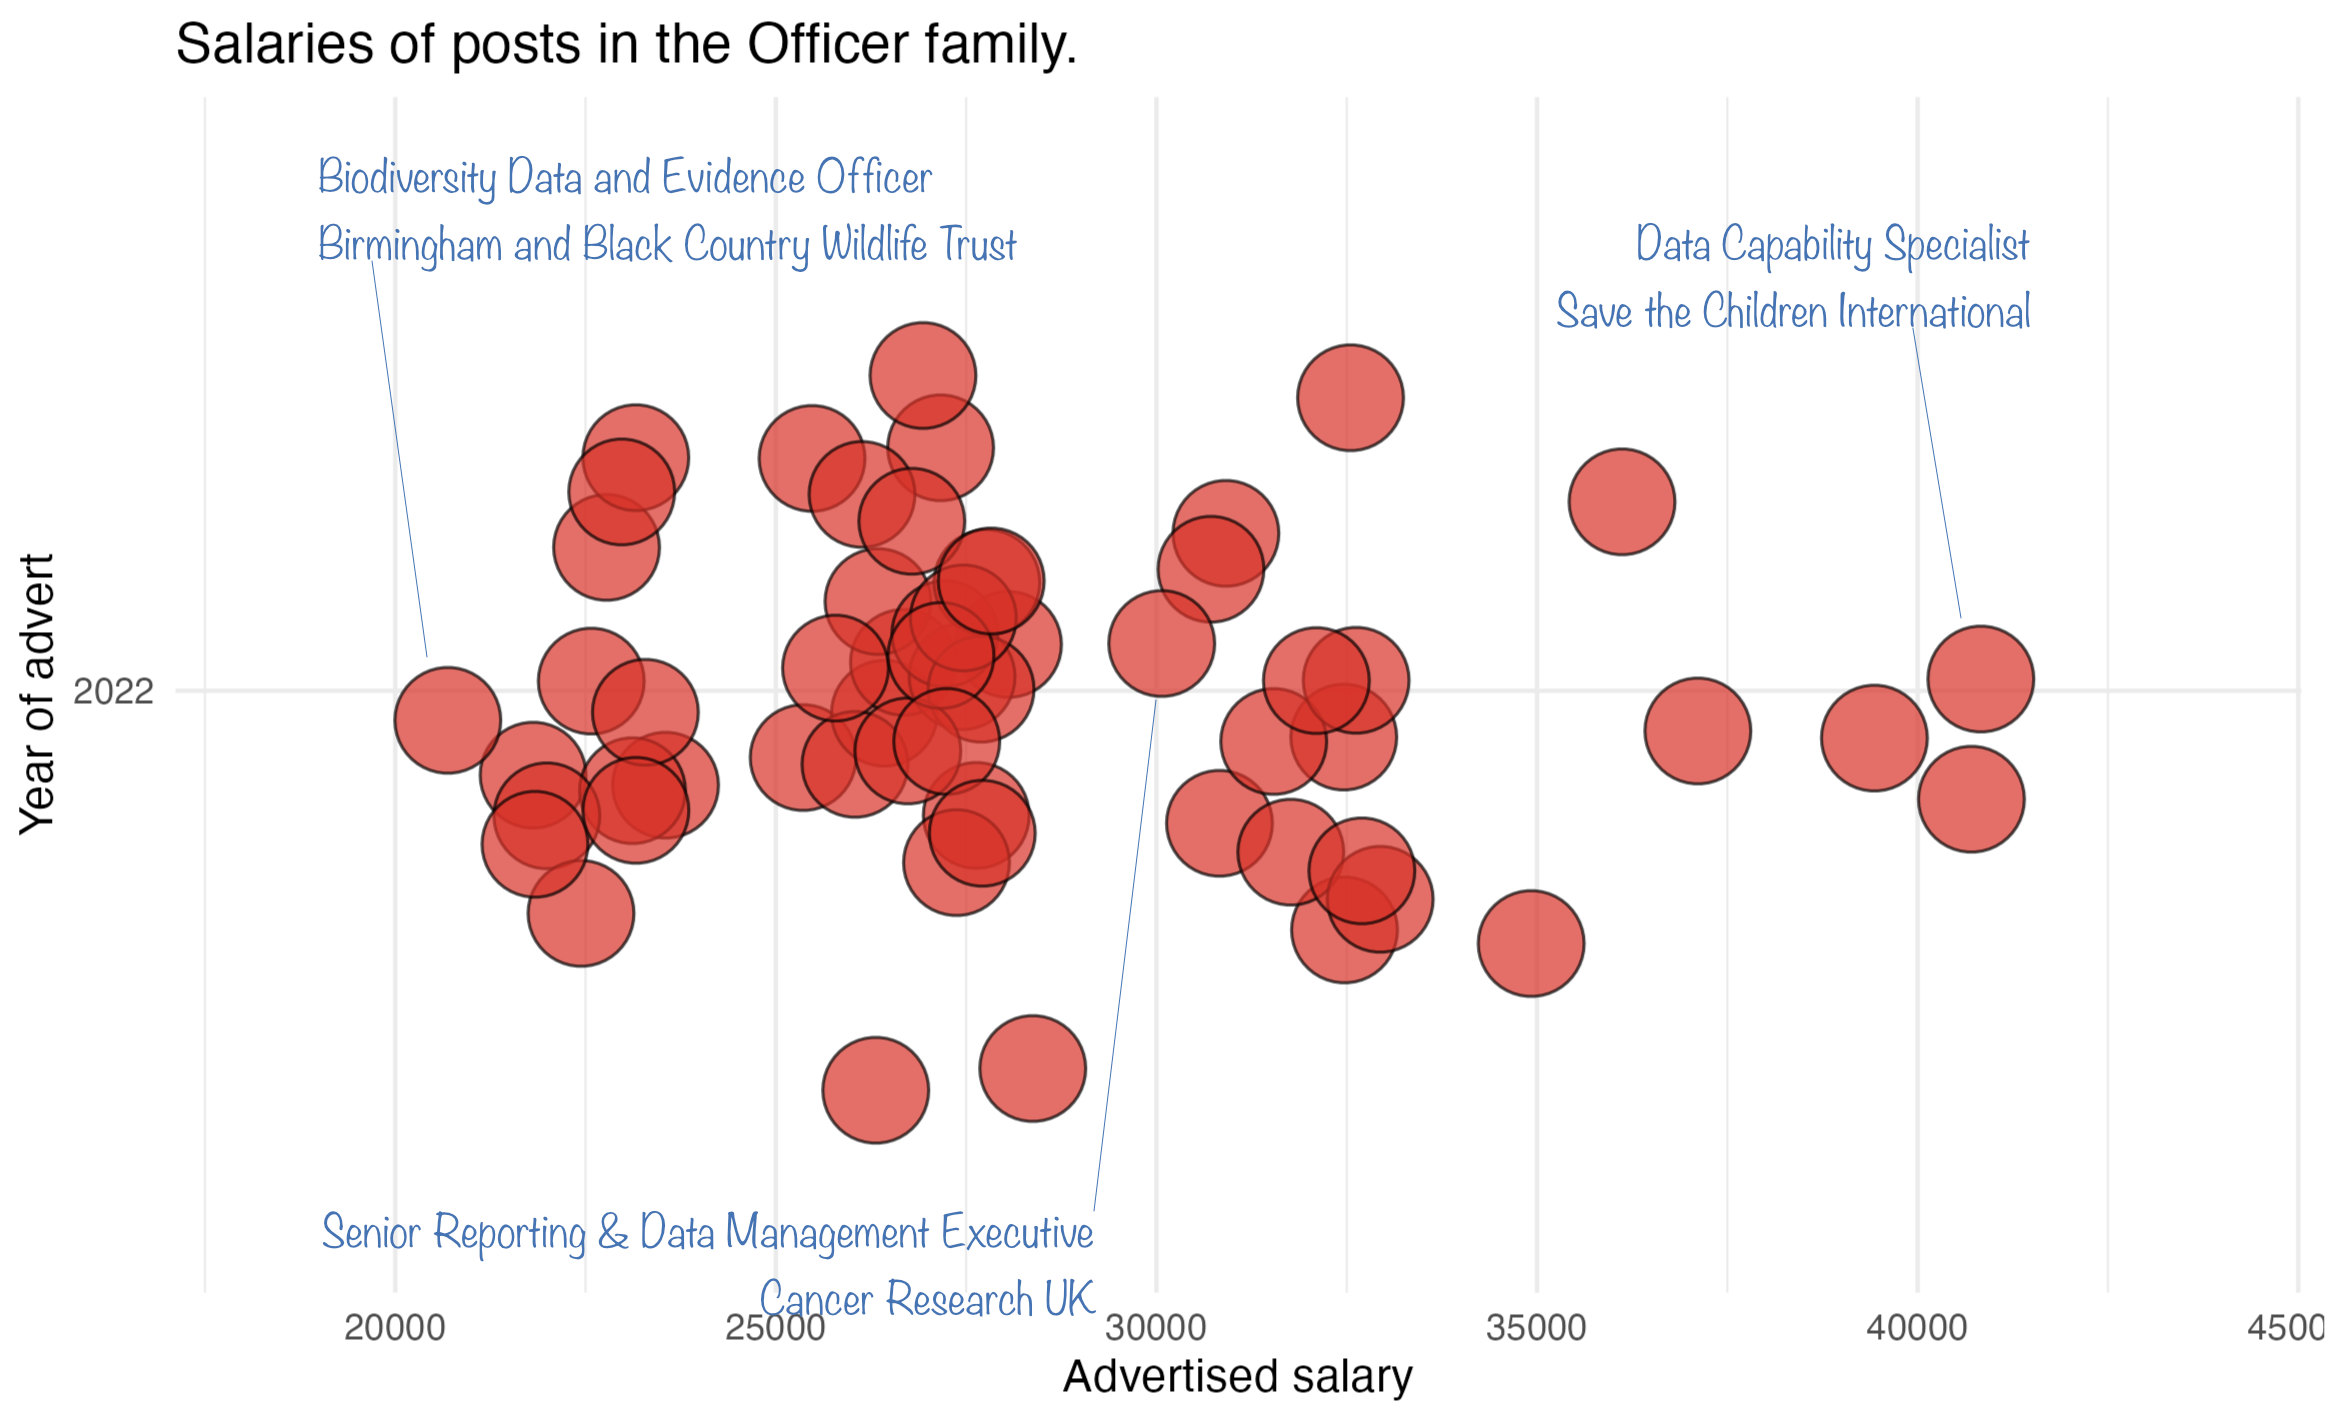
I find it really helpful to look at the spread of all salaries. These charts have a dot for each vacancy. I’ve annotated a few so you can see what sort of roles we’re talking about here.
I’ve drawn one chart for each calendar year.
2026
2025
2024
2023
2022
Analysts overall
This is a really interesting job family to me. I suspect that there are organisations who only need a data officer rather than a data analyst and the data suggests they will be paying less for that role.
But are there organisations who would get the value from an analyst who are only recruiting to officer roles?
I’d love to hear from employers and from people in data officer roles.
Data analyst salaries have been broadly flat for four years
What does the data tell us about data analyst roles in nonprofits?
In nonprofit organisations.
This is part three of a several part series analysing four years of data vacancy data in nonprofits. Part one gives an overview and explains a bit more about the dataset. Part two looks at Managers.
Analysts
My guess is that, in terms of my readers, this is the job family most people are interested in. Either because they are an analyst, would like to become one or would like to recruit one (or more).
This family includes jobs described as “Data Analyst” as well as a collection of other jobs which, in my judgement, are quite like the role of a data analyst.
How much analysts get paid
Analyst roles had median salaries of £38,175 in 2026. This was very slightly up from £37,079 in 2022. In fact what is striking is that there doesn’t seem to have been much increase in asking salaries for analysts across the four years I’ve been collecting vacancies. I’m not completely sure why this is but, given that there are plenty of adverts, I guess it suggests that there are enough people applying to hold the wages down. Anecdotally from subscribers I’ve not heard that organisations have trouble recruiting to this type of role.
Good news for recruiting managers.
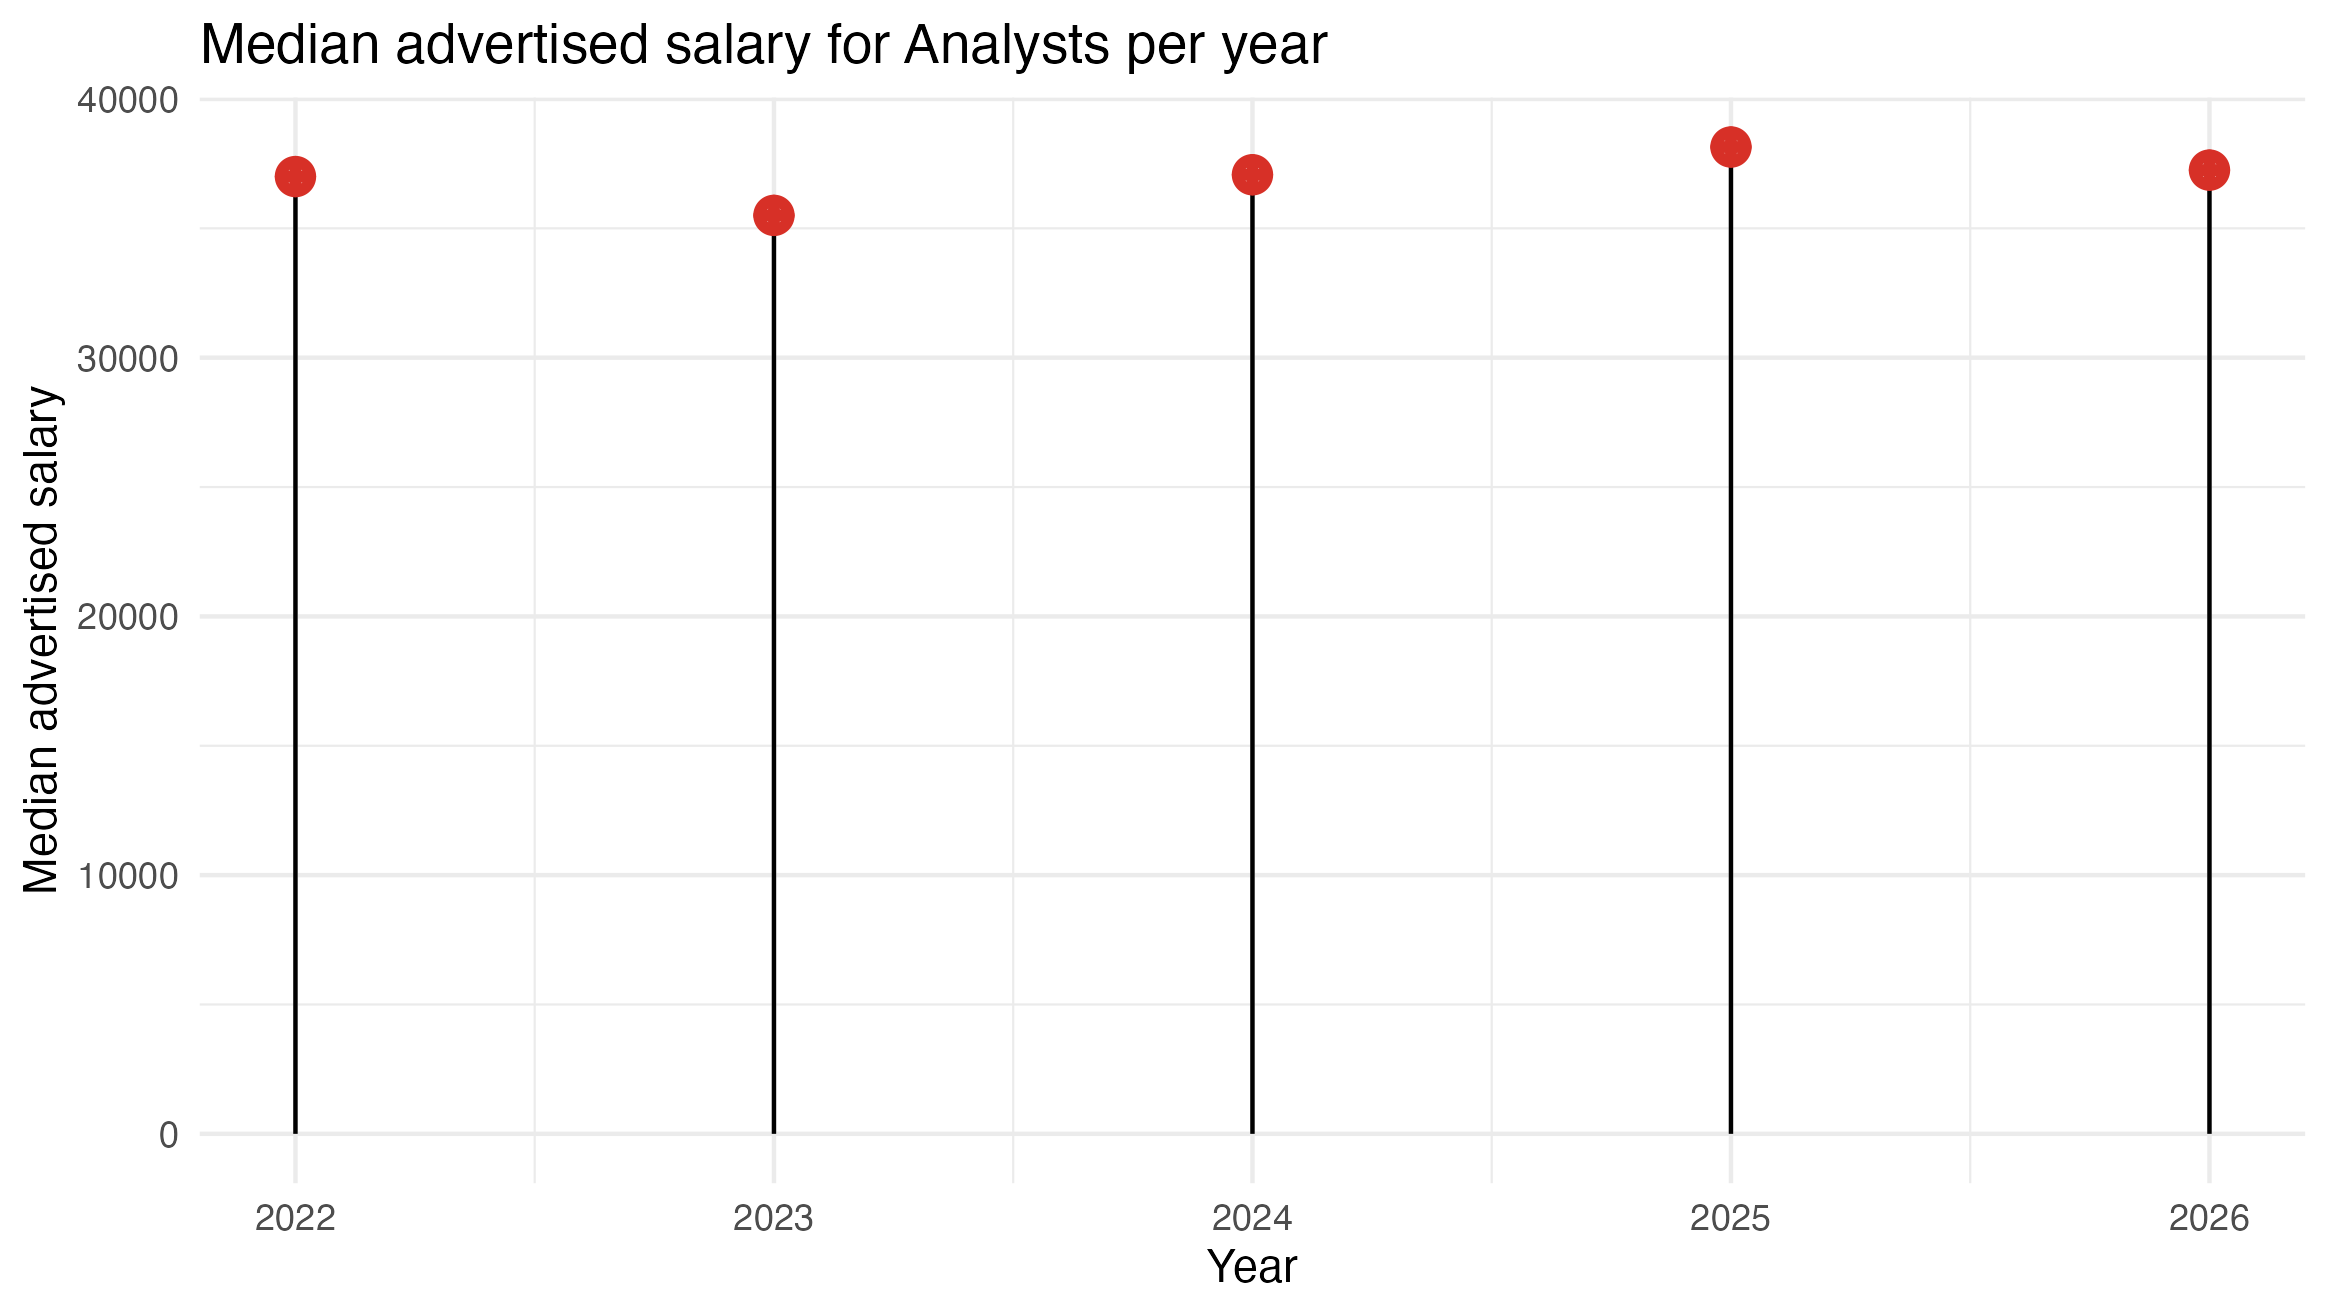
Let’s look at the graph many of you came for. The normal range of analyst salaries.
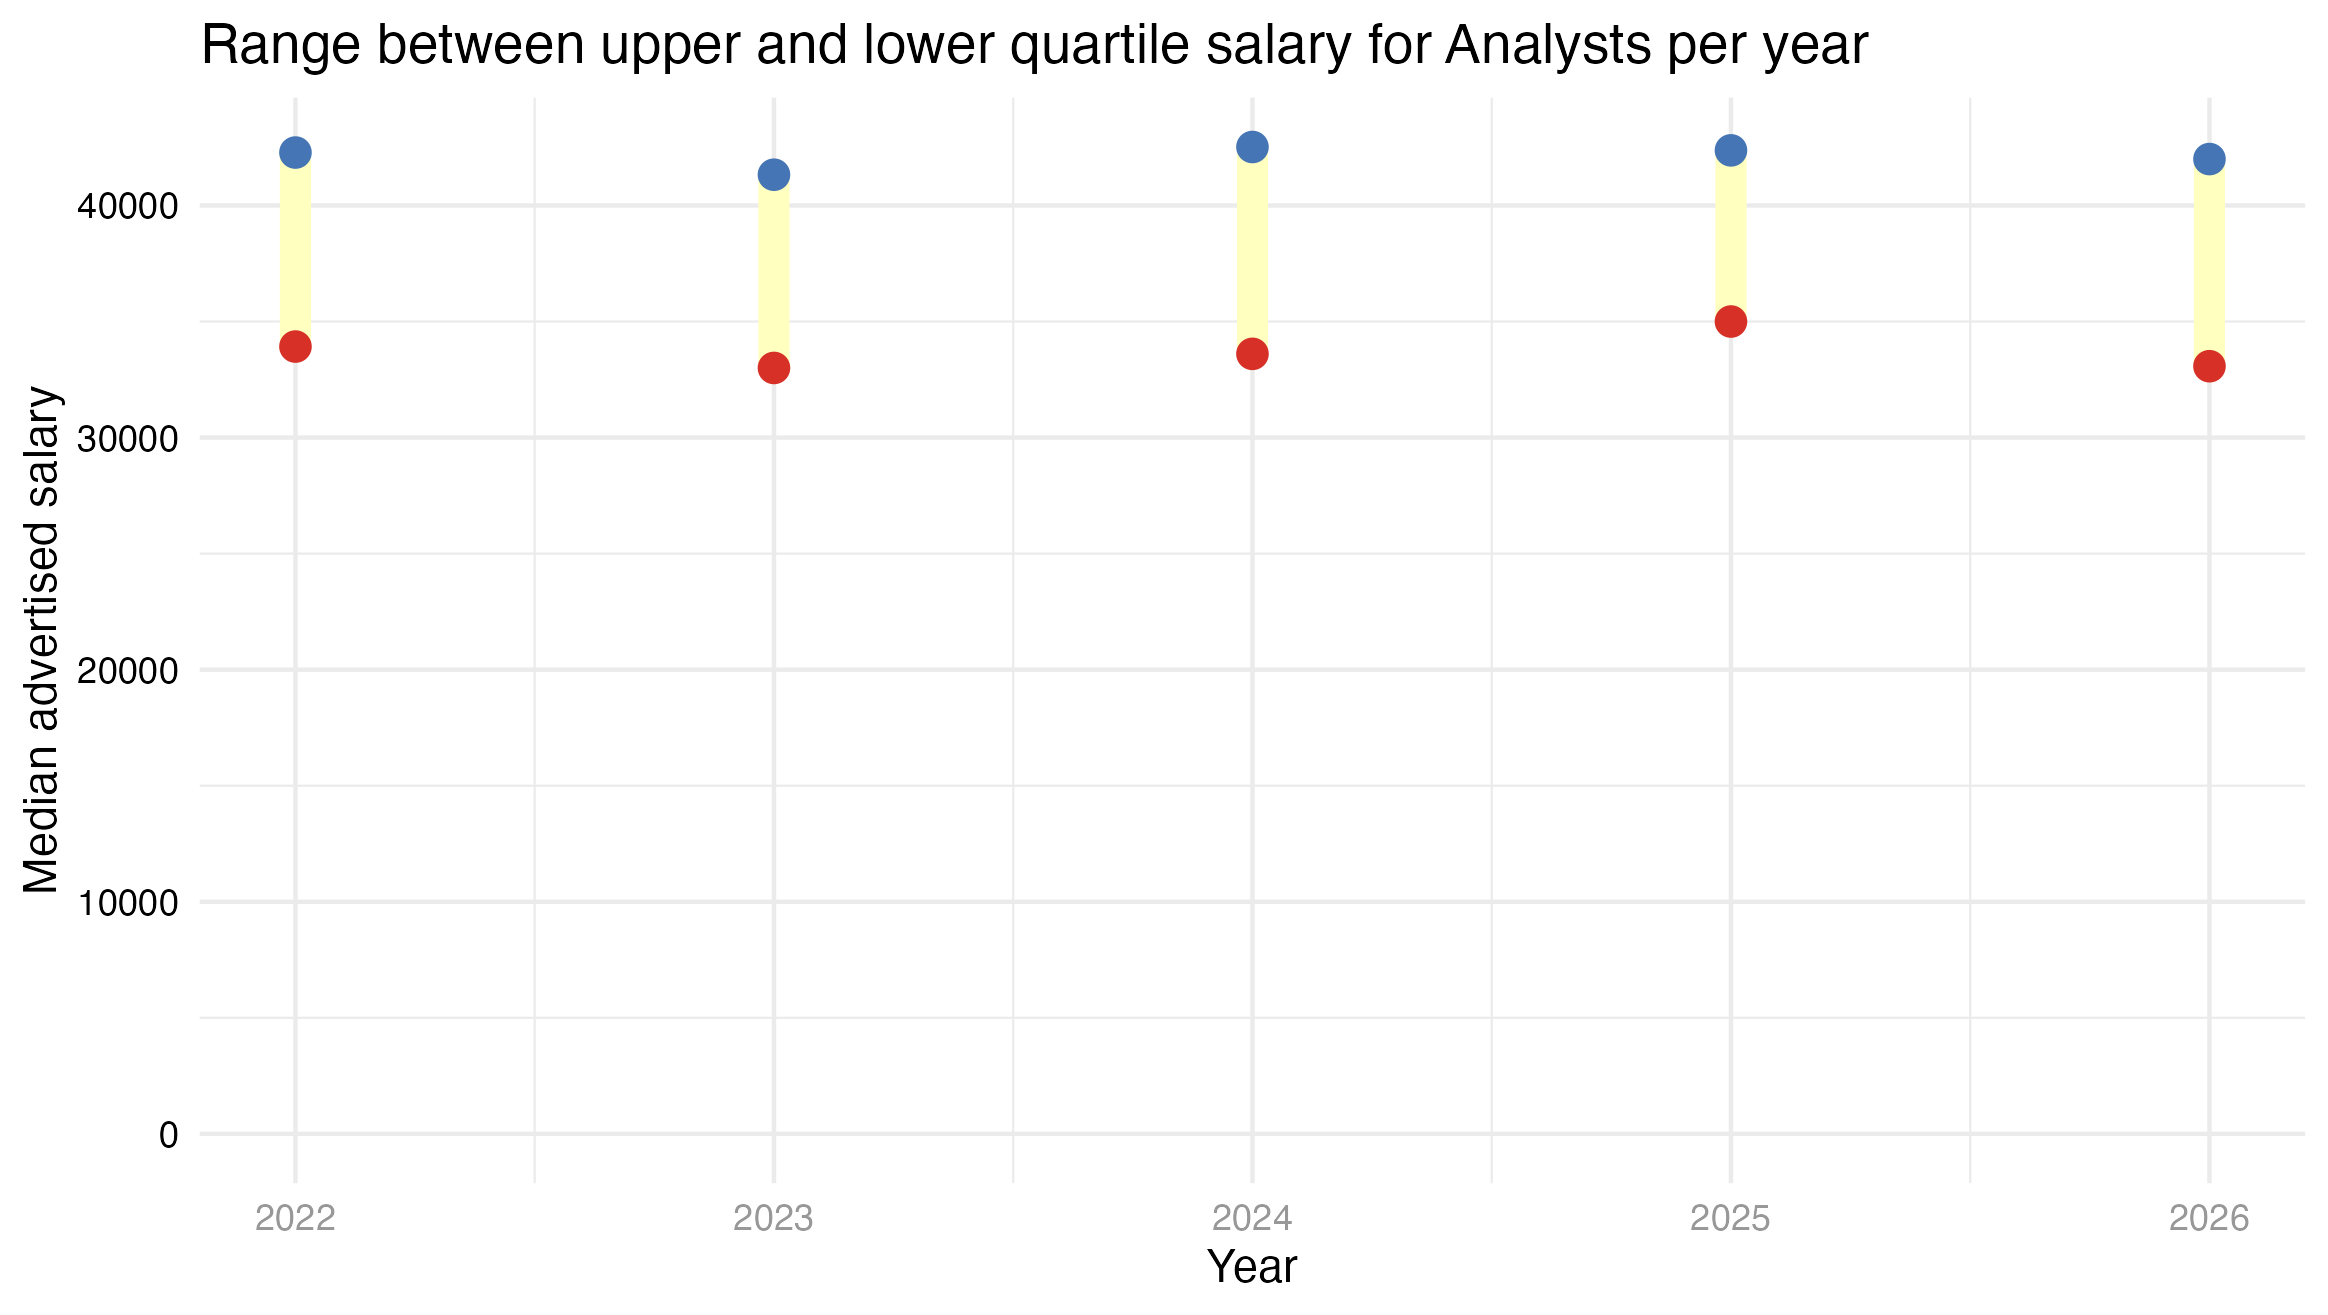
If your salary is between the dots then you're in the same range as 50% of analysts. If your salary is lower than the lower dot you're in the range where only 25% of analysts get paid this little. If your salary is higher than the high dot, you're in the range where only 25% of analysts get paid this much.
This is quite a tight range and, again, no real indication of much of an interest over time.
If your salary as an analyst is between £33K and £42K you are reasonably normal. Below £33K and maybe you should have a work with your boss. Above £42K maybe don’t let your boss see this post.
As always with this analysis these roles include London weighting where that is relevant.
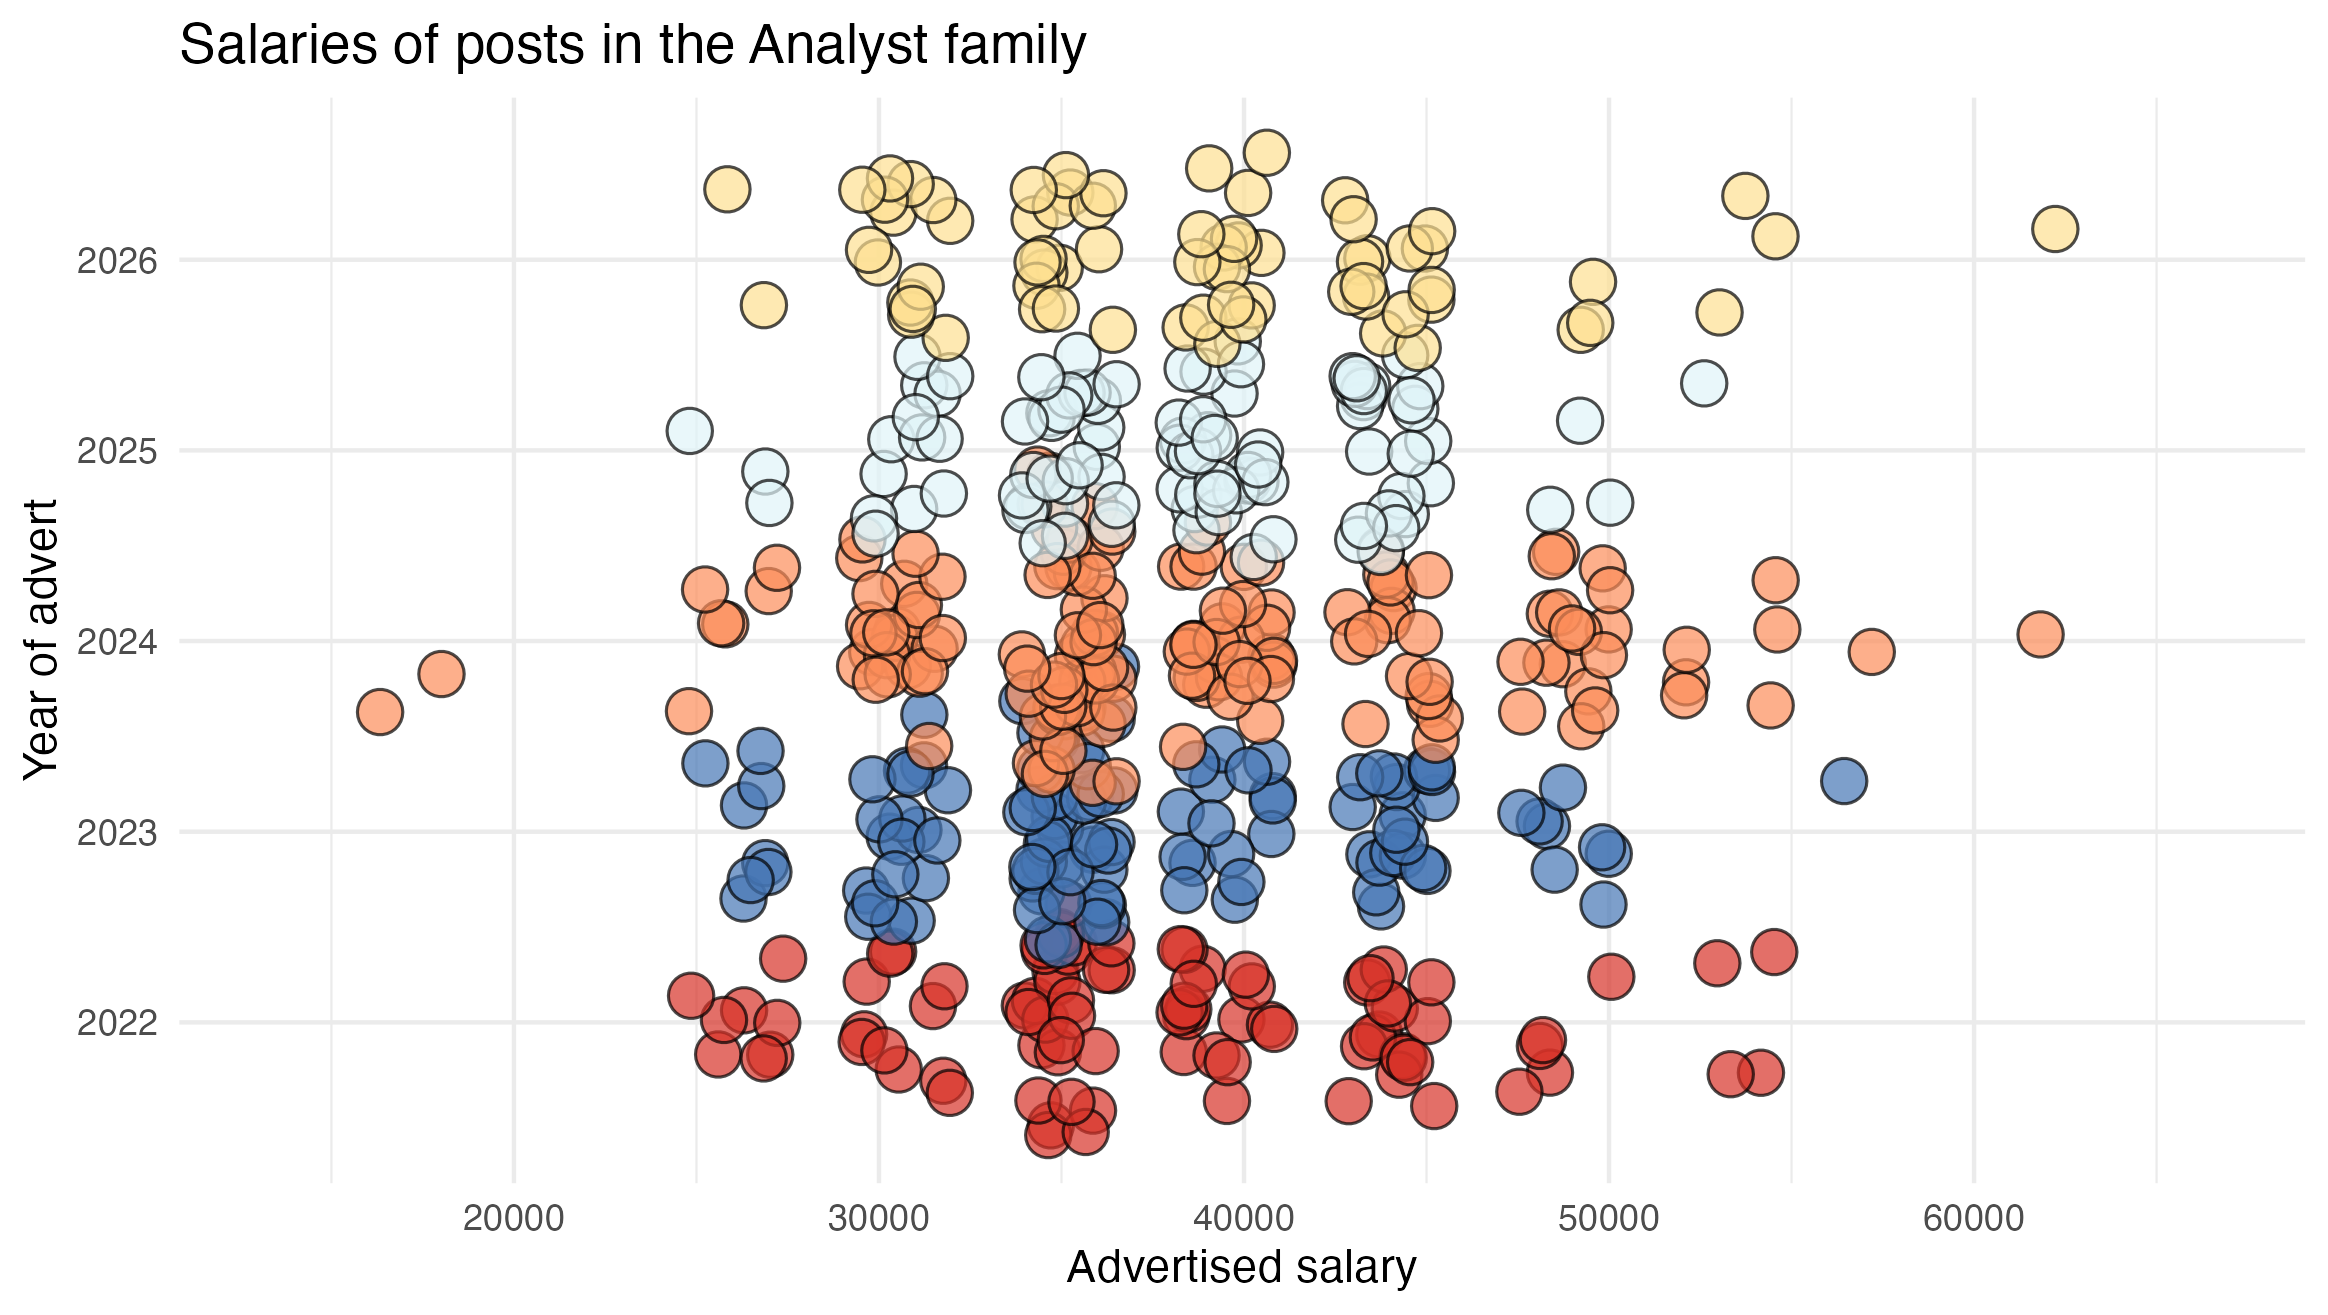
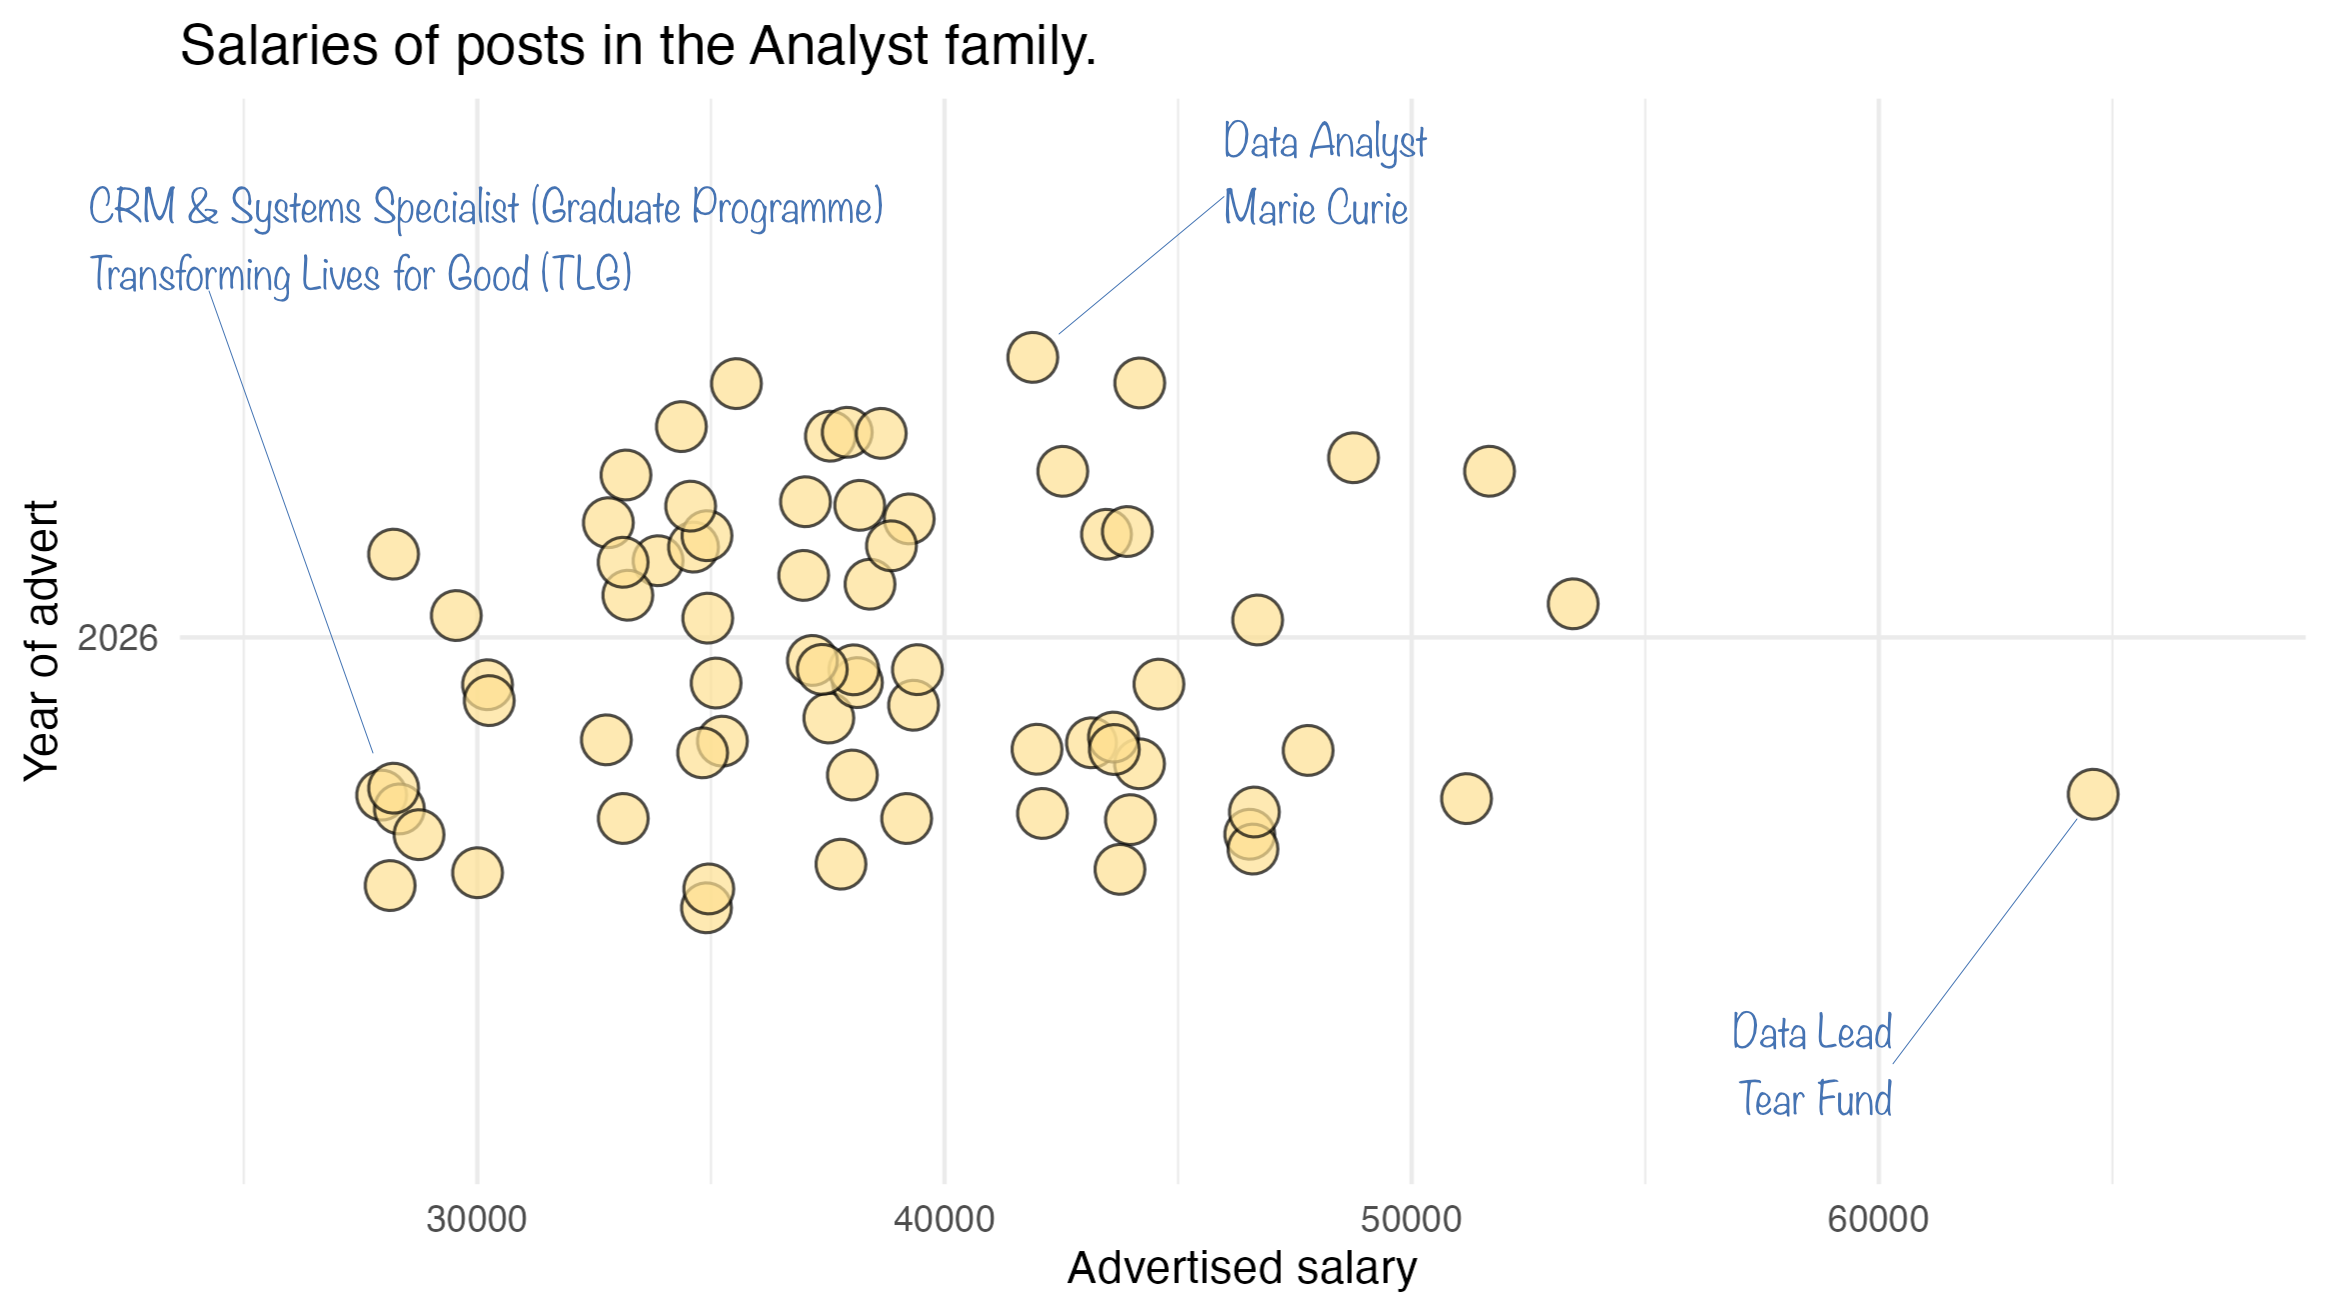
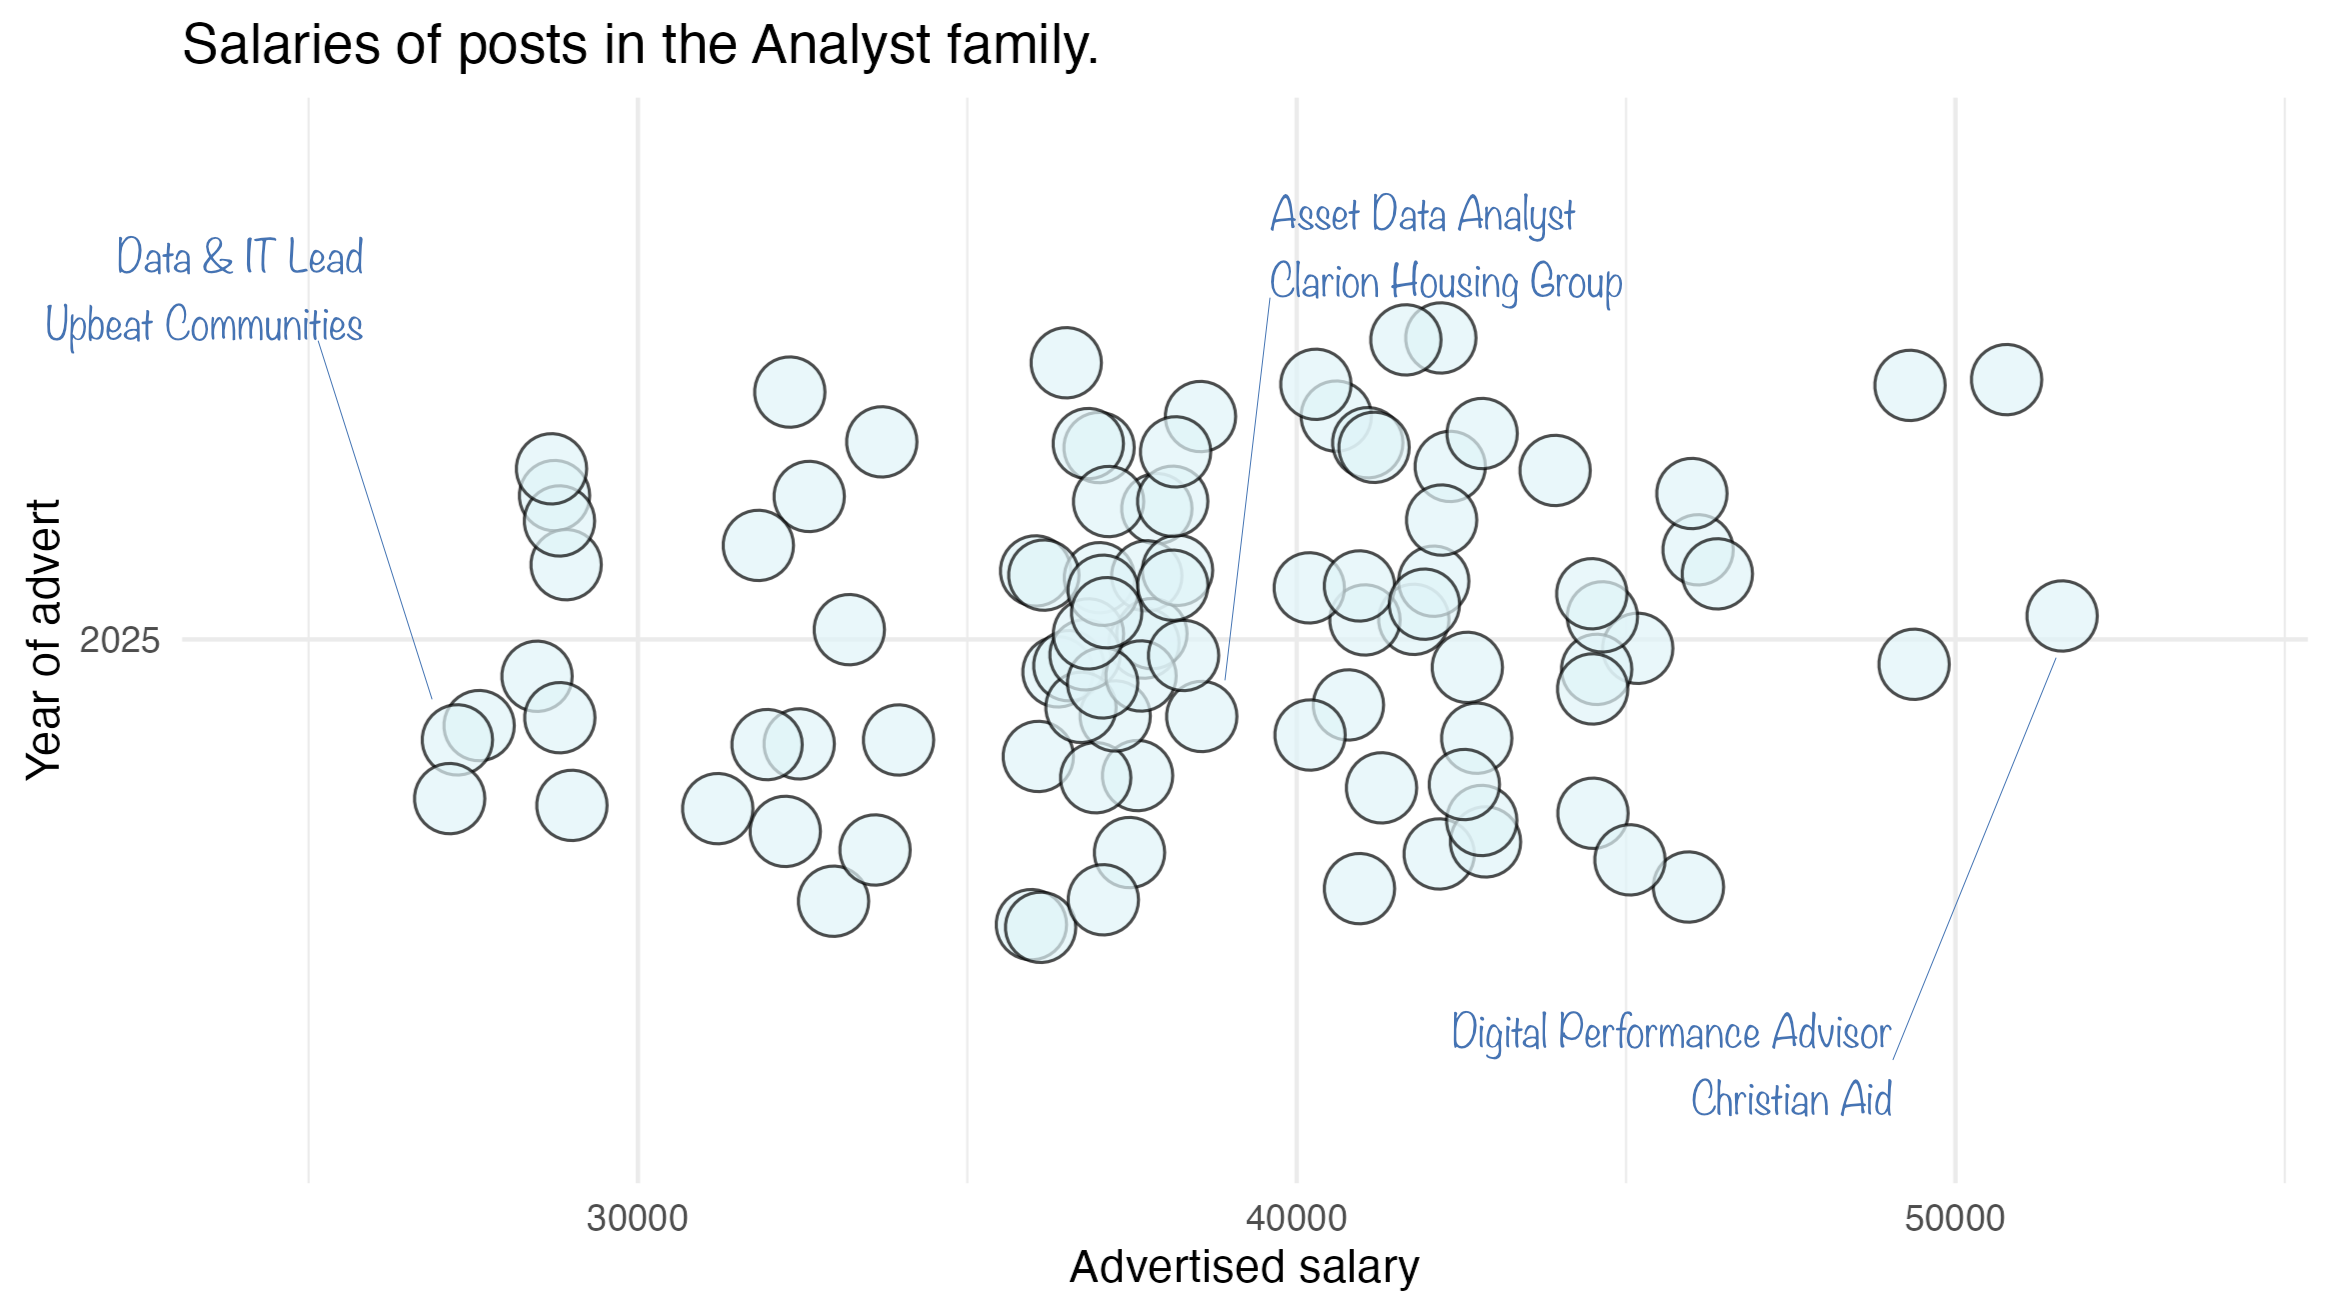
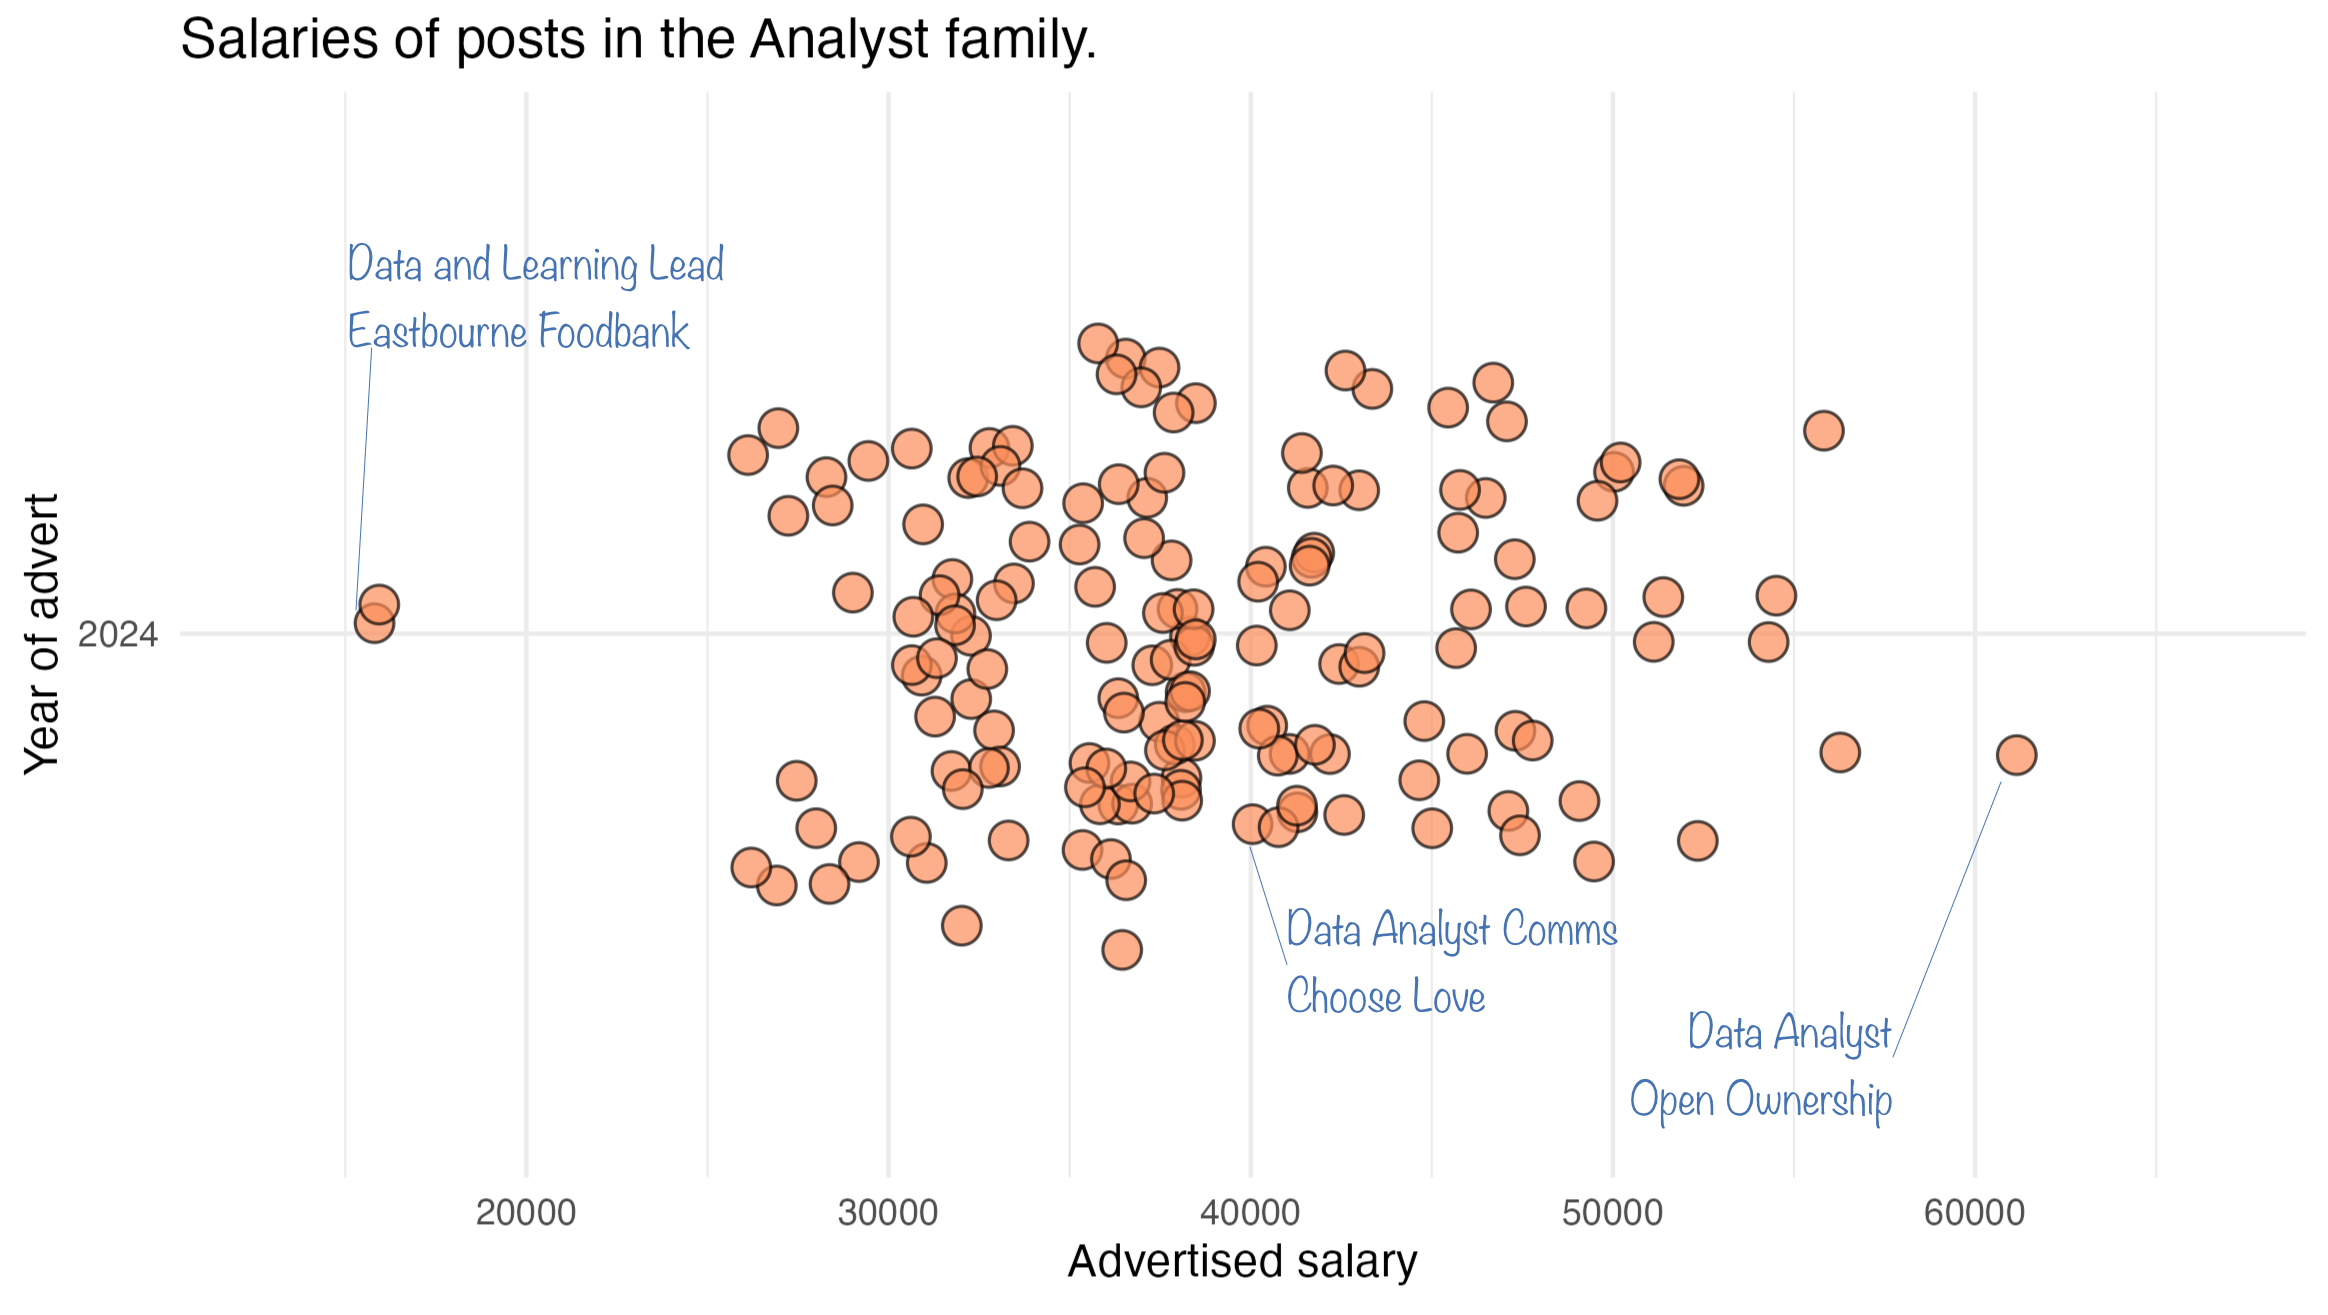
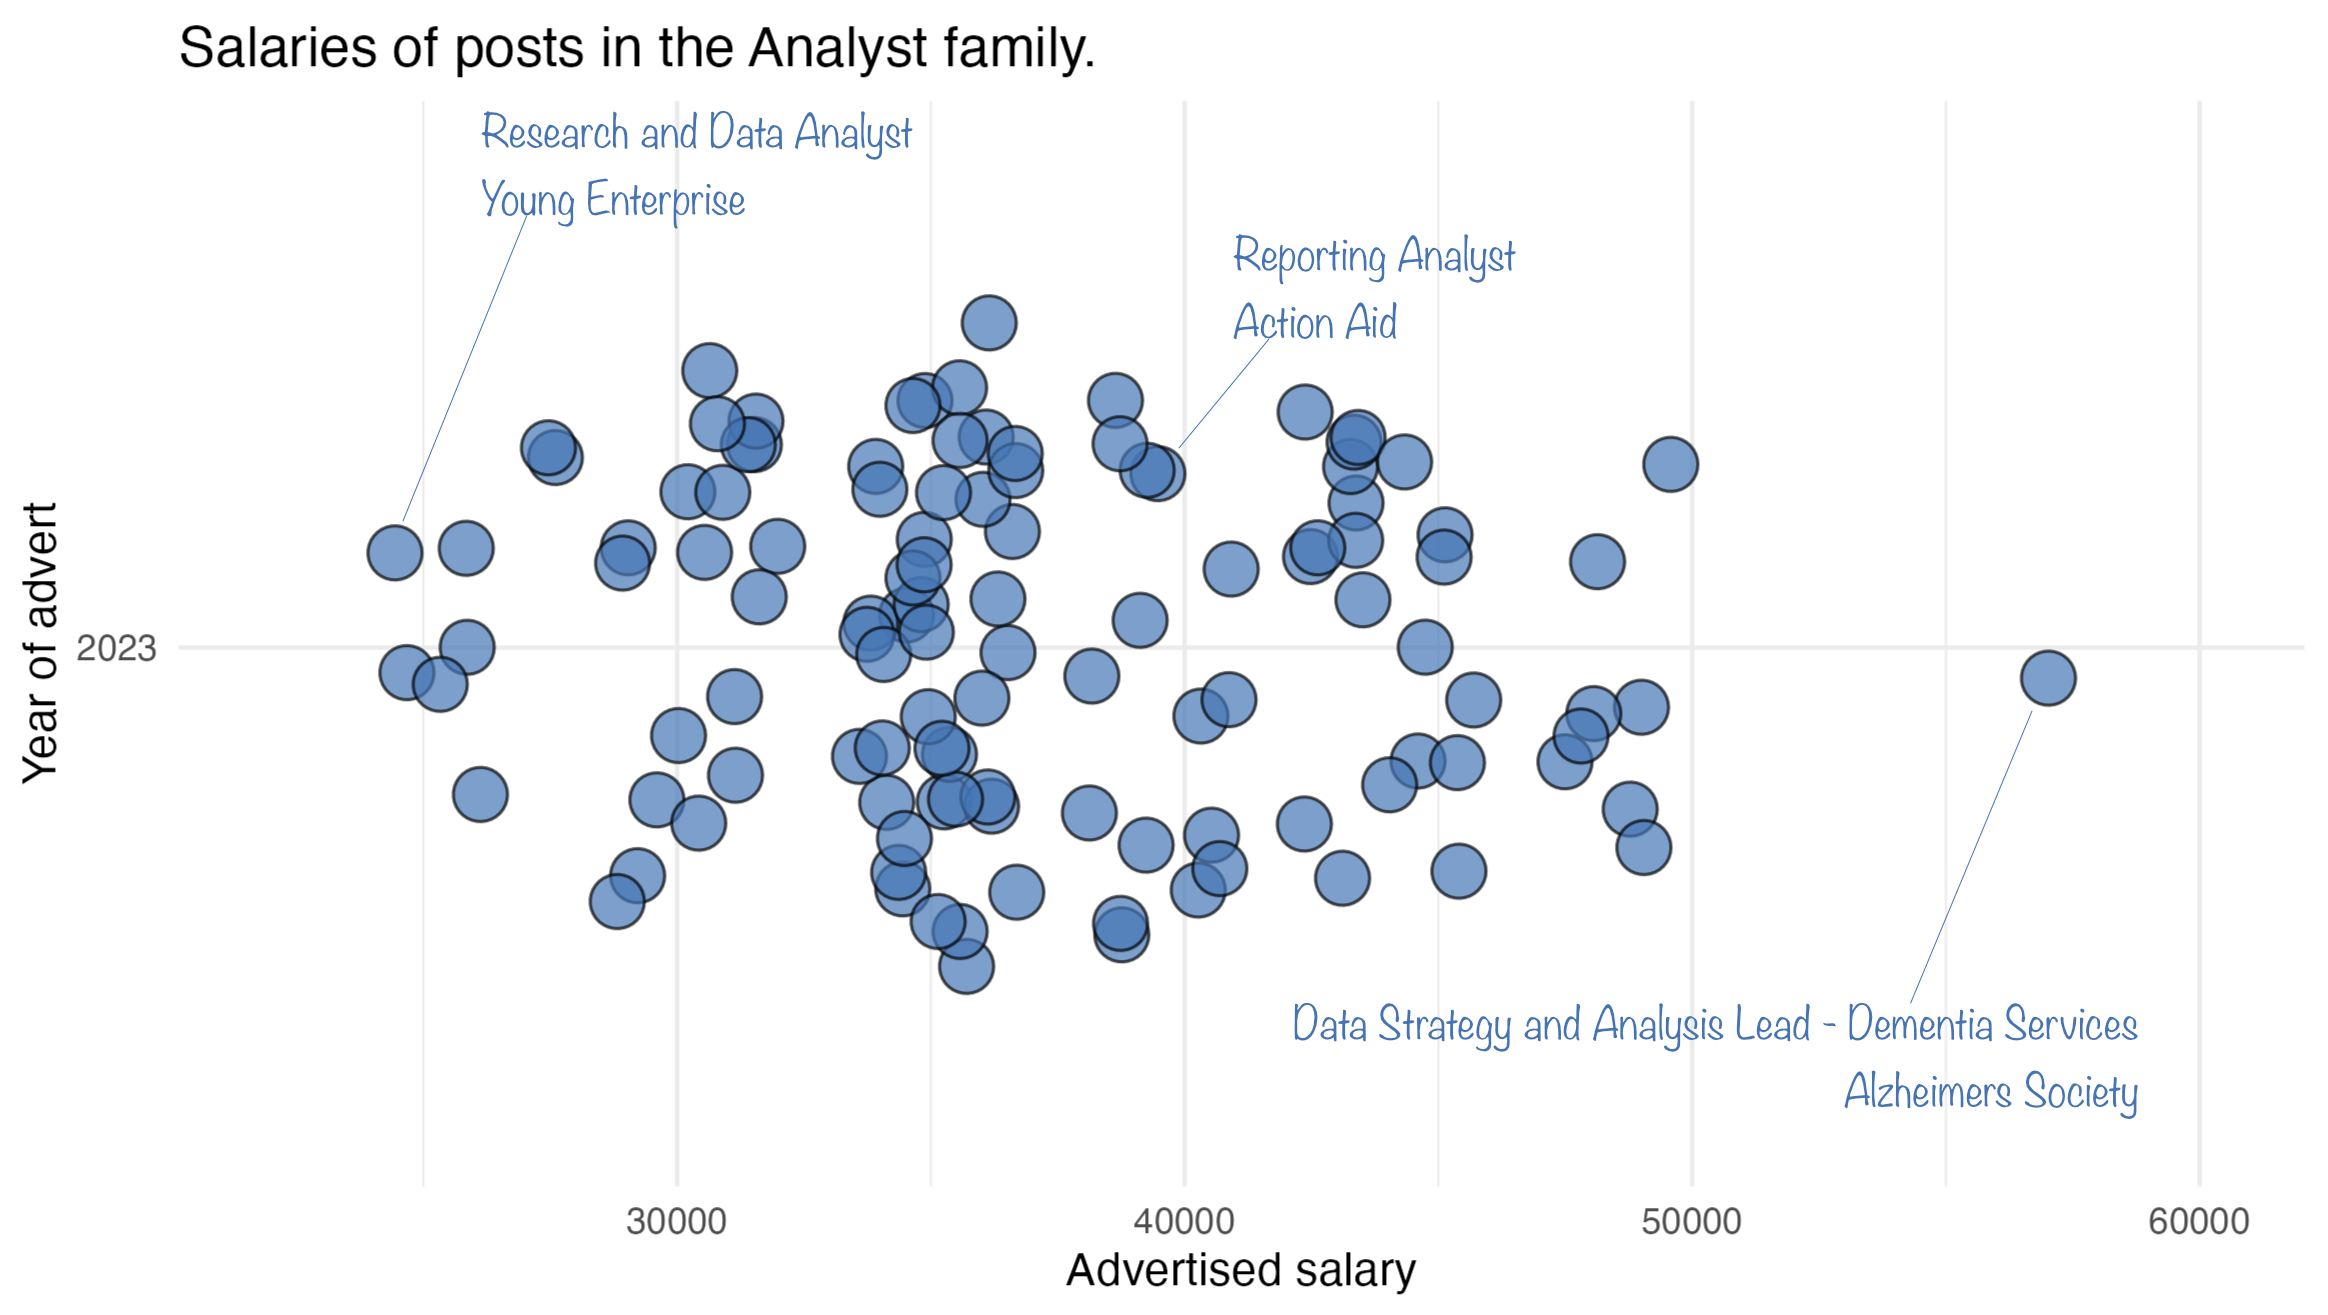
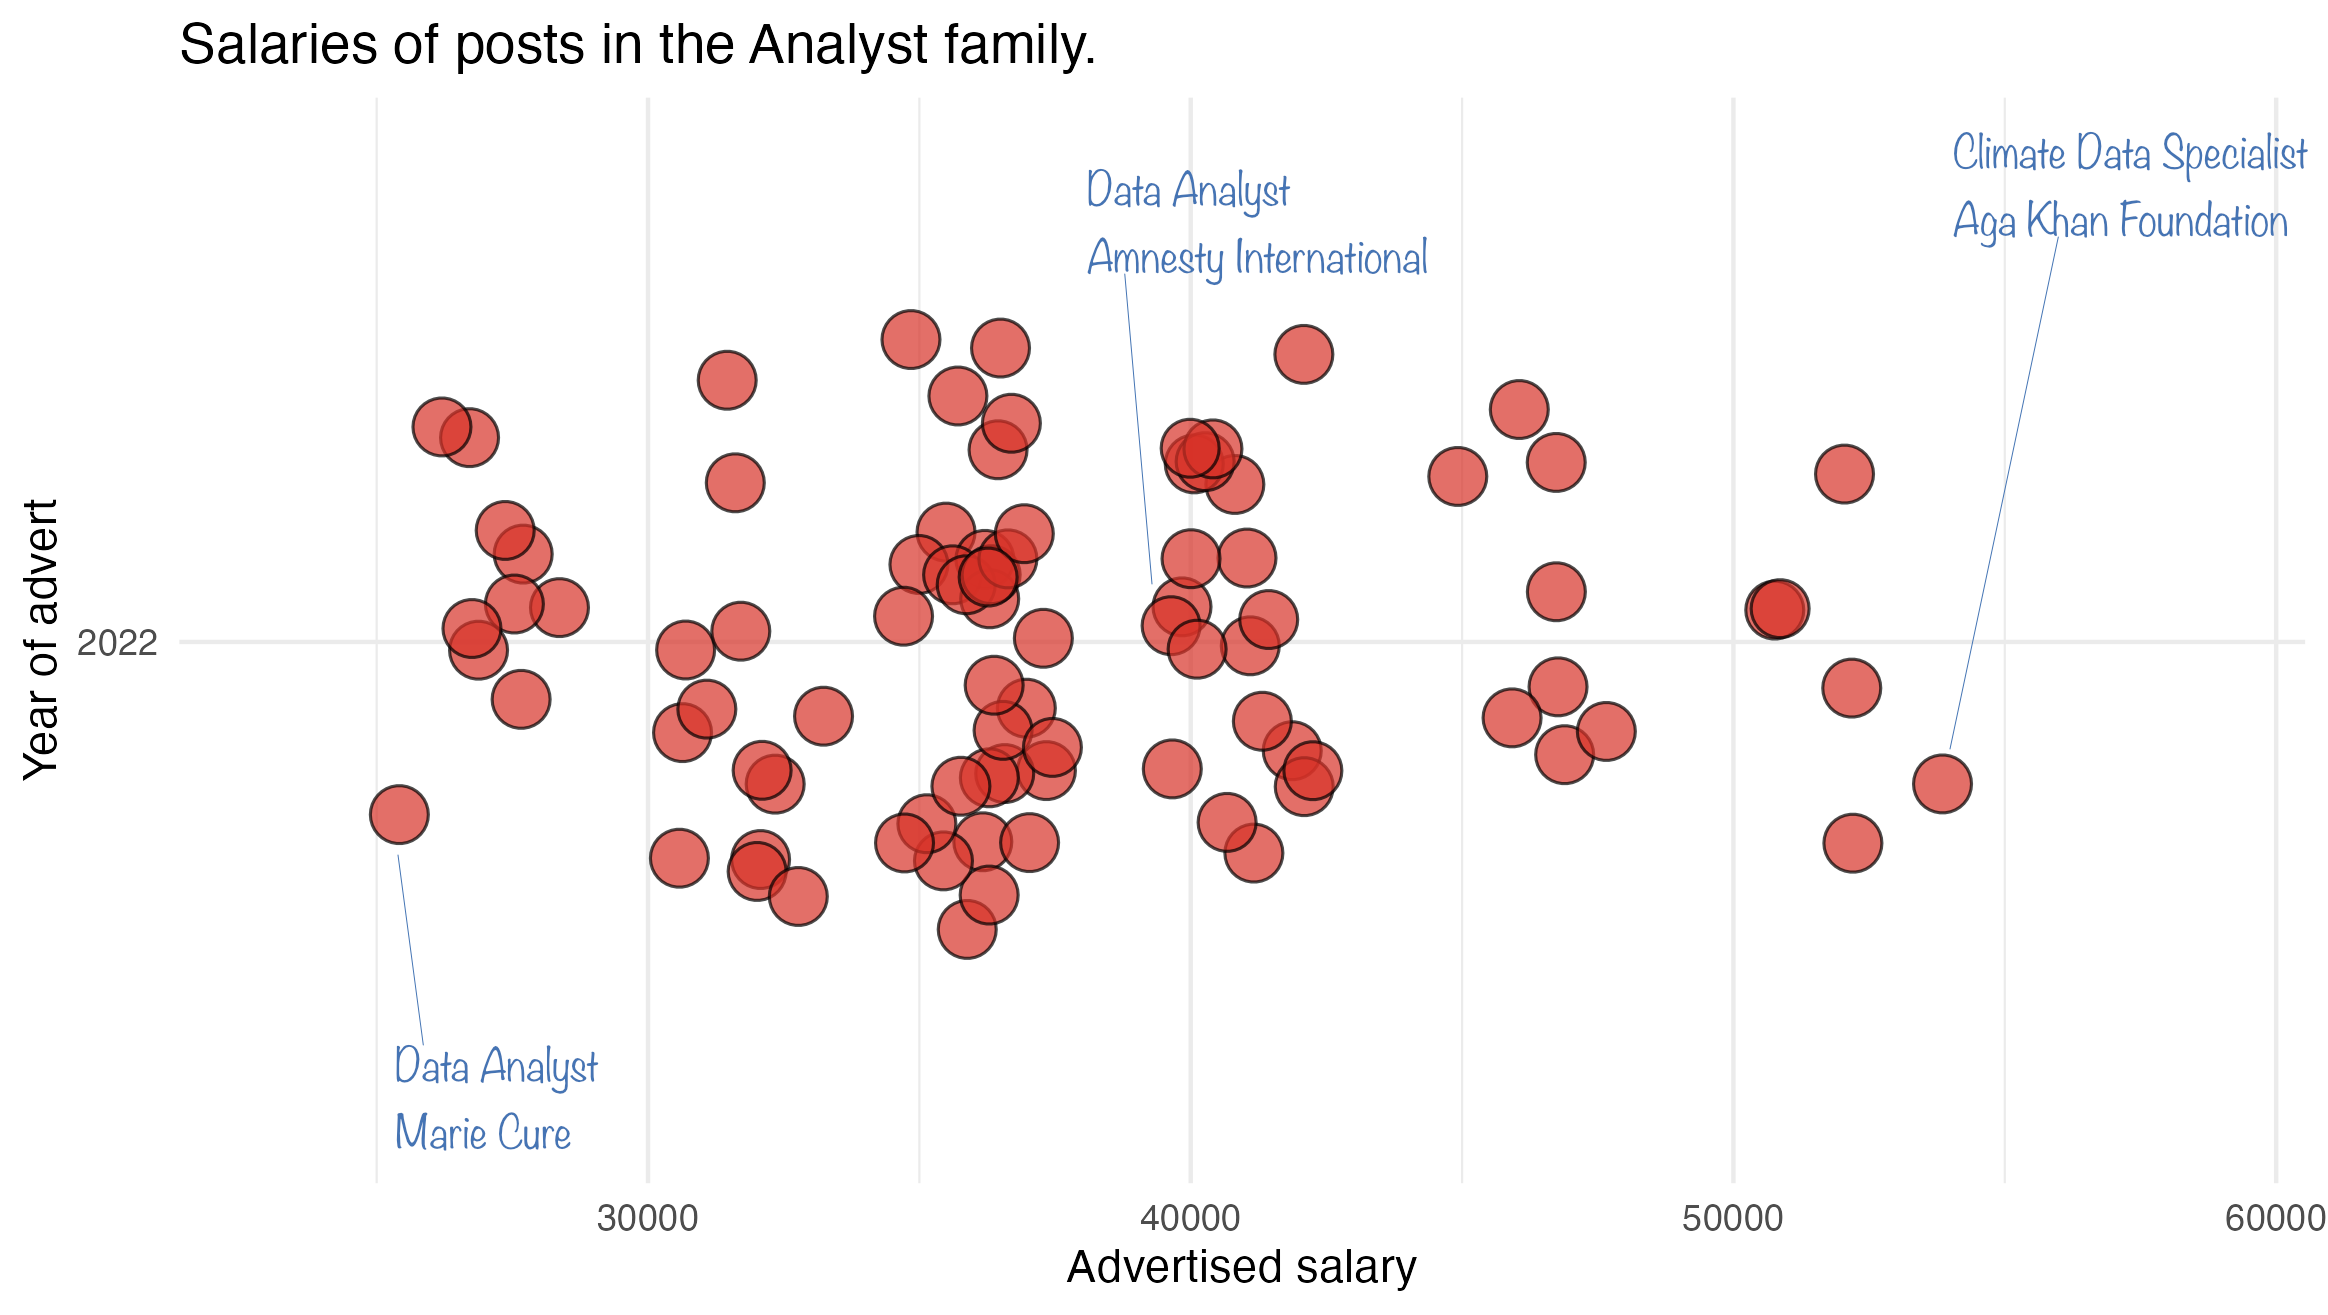
I find it really helpful to look at the spread of all salaries. These charts have a dot for each vacancy. I’ve annotated a few so you can see what sort of roles we’re talking about here.
I’ve drawn one chart for each calendar year.
2026
2025
2024
2023
2022
Analysts overall
I find it fascinating that I can’t see much evidence of an increase in asking salaries for analysts over the life of this analysis.
I can’t prove this but I wonder if, because data roles are new for many nonprofits, salaries for data analysts were pitched a bit high a few years ago. As the market sorts out what is a sensible salary organisations realise they can pay a little less which is masking the effect of underlying inflation.
I’d really love to hear from recruiting organisations about their experiences in setting salaries and recruiting to theses roles.

If you earn under £40K you’re underpaid
Analysis of salary benchmarking data for managers in data roles in nonprofits;
As a manager in a data role in a nonprofit that is.
This is part two of a several part series analysing four years of data vacancy data in nonprofits. Part one gives an overview and explains a bit more about the dataset.
Managers
Let's look at the Manager job family.
This family includes quite a diverse set of roles. Broadly if it looks to me like it has some level of seniority but isn’t a “senior analyst” or if it looks like it involves line management but isn’t a head-of or director role I stick it in here.
How much managers get paid
Manager roles had median salaries of £45,700 in 2026. Up from £42,000 in 2022.

Let's look at the spread of advertised salaries. Here's the spread between lower quartile and upper quartile.

If your salary is between the dots then you're in the same range as 50% of managers. If your salary is lower than the lower dot you're in the range where only 25% of managers get paid this little. If your salary is higher than the high dot, you're in the range where only 25% of managers get paid this much.
Or to put it another way. If your role is in this manager family and you earn under £40K you’re not well paid. Whereas if your salary is about £52,000 you are doing very well. Though it’s worth bearing in mind that these roles include London weighting where that is relevant so if you are based outside London you might want to knock a few thousand quid off that benchmark.
I find it really helpful to look at the spread of all salaries. These charts have a dot for each vacancy. I’ve annotated a few so you can see what sort of roles we’re talking about here.
I’ve drawn one chart for each calendar year. There’s some evidence of wage inflation in this dataset so bear that in mind as you go back in time.
2026

2025
2024

2023

2022

Working styles
The majority of Manager roles are hybrid positions. On-site positions are the next common but 19% of roles are Remote (this includes roles where Remote is an option). That's pretty much the same split as data jobs overall.

What can you do with this?
If you work in a data role that might be considered a manager in a data role in a nonprofit I hope this will give you a sense of how your salary compares to the benchmark. If you have an HR or executive role in a non-profit then hopefully this will help you think about the costs of recruitment and retention.
The other thing I have always hoped this newsletter will achieve is demonstrate to data professionals outside the nonprofit sector that there are viable, interesting (and socially impactful) roles in nonprofits. But this might also give you a reality check about the financial rewards of moving into the sector.